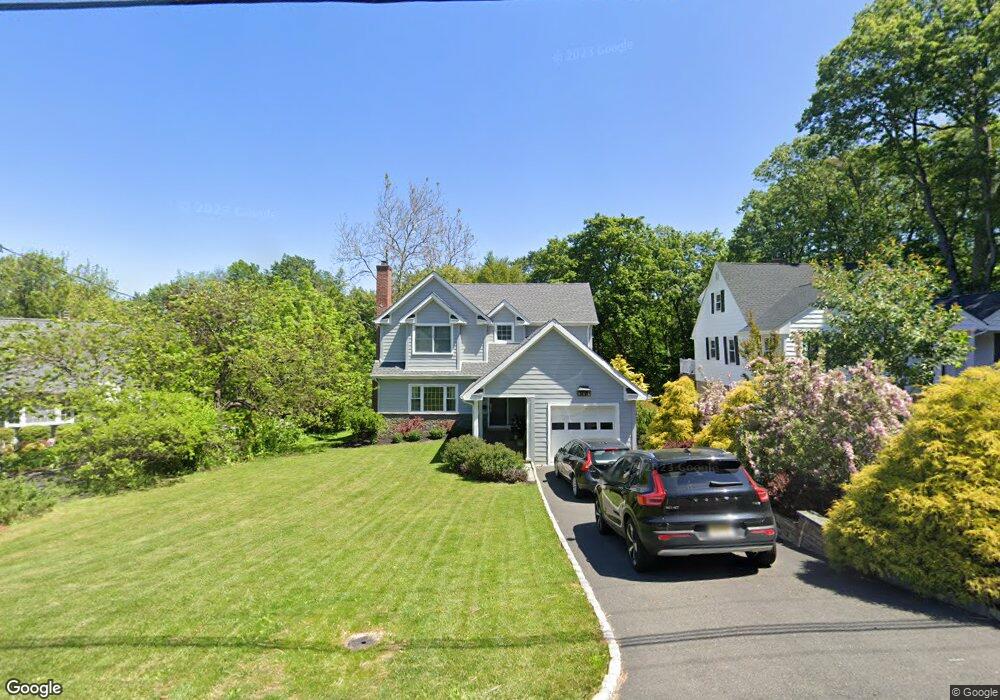
39 the Fellsway New Providence, NJ 07974
Estimated Value: $898,000 - $1,283,296
--
Bed
--
Bath
2,443
Sq Ft
$436/Sq Ft
Est. Value
About This Home
This home is located at 39 the Fellsway, New Providence, NJ 07974 and is currently estimated at $1,065,324, approximately $436 per square foot. 39 the Fellsway is a home located in Union County with nearby schools including New Providence High School, The Academy of Our Lady of Peace, and Oak Knoll School of the Holy Child.
Ownership History
Date
Name
Owned For
Owner Type
Purchase Details
Closed on
Apr 15, 2010
Sold by
Graziano Christopher and Graziano Kathleen
Bought by
Hazlett Christopher and Hazlett Tamara
Current Estimated Value
Home Financials for this Owner
Home Financials are based on the most recent Mortgage that was taken out on this home.
Original Mortgage
$420,000
Outstanding Balance
$279,734
Interest Rate
5%
Mortgage Type
New Conventional
Estimated Equity
$785,590
Purchase Details
Closed on
Apr 30, 2004
Sold by
Berreman Dorothy
Bought by
Graziano Christopher and Graziano Kathleen
Home Financials for this Owner
Home Financials are based on the most recent Mortgage that was taken out on this home.
Original Mortgage
$300,000
Interest Rate
5.39%
Purchase Details
Closed on
Feb 7, 1997
Sold by
Berreman Dorothy W
Bought by
Berreman Dorothy W
Create a Home Valuation Report for This Property
The Home Valuation Report is an in-depth analysis detailing your home's value as well as a comparison with similar homes in the area
Home Values in the Area
Average Home Value in this Area
Purchase History
| Date | Buyer | Sale Price | Title Company |
|---|---|---|---|
| Hazlett Christopher | $535,000 | None Available | |
| Graziano Christopher | $430,000 | -- | |
| Berreman Dorothy W | -- | -- |
Source: Public Records
Mortgage History
| Date | Status | Borrower | Loan Amount |
|---|---|---|---|
| Open | Hazlett Christopher | $420,000 | |
| Previous Owner | Graziano Christopher | $300,000 |
Source: Public Records
Tax History Compared to Growth
Tax History
| Year | Tax Paid | Tax Assessment Tax Assessment Total Assessment is a certain percentage of the fair market value that is determined by local assessors to be the total taxable value of land and additions on the property. | Land | Improvement |
|---|---|---|---|---|
| 2025 | $19,910 | $385,700 | $127,900 | $257,800 |
| 2024 | $19,312 | $385,700 | $127,900 | $257,800 |
| 2023 | $19,312 | $385,700 | $127,900 | $257,800 |
| 2022 | $19,046 | $385,700 | $127,900 | $257,800 |
| 2021 | $18,907 | $385,700 | $127,900 | $257,800 |
| 2020 | $18,899 | $385,700 | $127,900 | $257,800 |
| 2019 | $11,854 | $243,400 | $127,900 | $115,500 |
| 2018 | $11,793 | $243,400 | $127,900 | $115,500 |
| 2017 | $11,600 | $243,400 | $127,900 | $115,500 |
| 2016 | $11,437 | $243,400 | $127,900 | $115,500 |
| 2015 | $11,279 | $243,400 | $127,900 | $115,500 |
| 2014 | $11,109 | $243,400 | $127,900 | $115,500 |
Source: Public Records
Map
Nearby Homes
- 45 the Fellsway
- 106 Stoneridge Rd
- 52 Greenwood Rd
- 294 Livingston Ave
- 34 Grant Ave
- 54 Badgley Dr
- 140 Countryside Dr
- 72 Central Ave
- 282 South St
- 16 Riverbend Ct
- 183 Countryside Dr
- 32 Marion Ave
- 6 Joanna Way
- 50 Livingston Ave
- 20 High St
- 25 Murray Hill Square
- 1200 Springfield Ave Unit 1B
- 34 Sweetbriar Rd
- 19 Division Ave
- 17 Valley View Ave