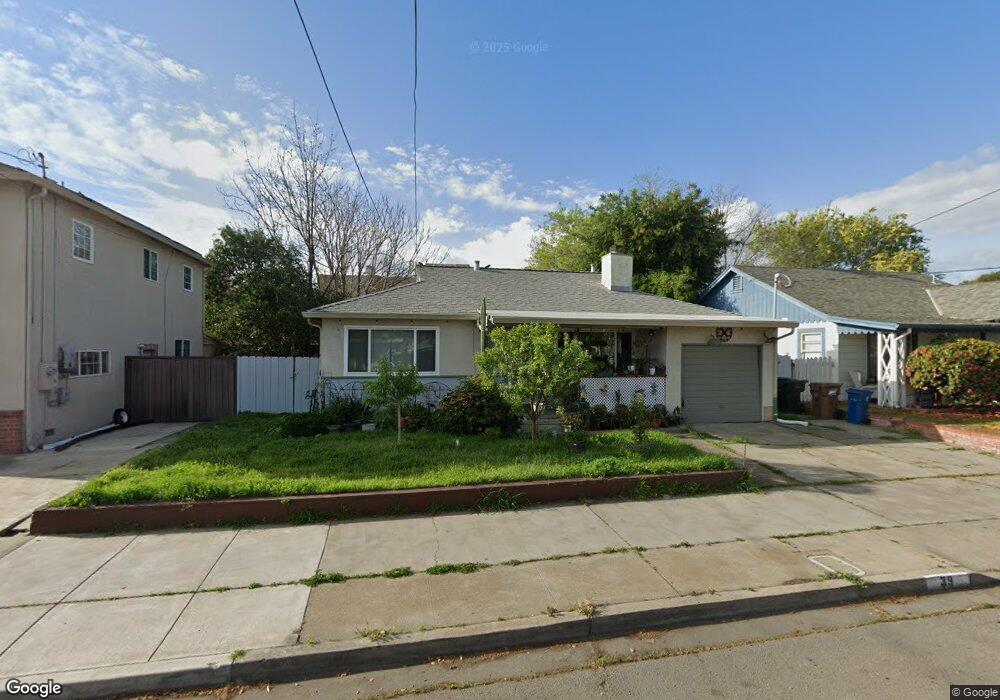
39 W 18th St Antioch, CA 94509
North Antioch NeighborhoodEstimated Value: $393,000 - $484,040
3
Beds
2
Baths
1,482
Sq Ft
$308/Sq Ft
Est. Value
About This Home
This home is located at 39 W 18th St, Antioch, CA 94509 and is currently estimated at $456,510, approximately $308 per square foot. 39 W 18th St is a home located in Contra Costa County with nearby schools including Fremont Elementary School, Antioch Middle School, and Antioch High School.
Ownership History
Date
Name
Owned For
Owner Type
Purchase Details
Closed on
Jan 3, 2019
Sold by
Jain Roop and Jain Shobha
Bought by
Xu Lejun and Huang Yanhua
Current Estimated Value
Home Financials for this Owner
Home Financials are based on the most recent Mortgage that was taken out on this home.
Original Mortgage
$274,800
Outstanding Balance
$246,342
Interest Rate
5.62%
Mortgage Type
Adjustable Rate Mortgage/ARM
Estimated Equity
$210,168
Purchase Details
Closed on
Nov 1, 2018
Sold by
Wlliott Kristi
Bought by
Jain Roop and Jain Shoha
Purchase Details
Closed on
Dec 27, 2016
Sold by
Elliott Kristi A
Bought by
Elliott Kristi
Home Financials for this Owner
Home Financials are based on the most recent Mortgage that was taken out on this home.
Original Mortgage
$206,250
Interest Rate
3.94%
Mortgage Type
New Conventional
Purchase Details
Closed on
Jan 28, 2009
Sold by
Deutsche Bank National Trust Company
Bought by
Elliott Kristi A
Home Financials for this Owner
Home Financials are based on the most recent Mortgage that was taken out on this home.
Original Mortgage
$108,007
Interest Rate
5.03%
Mortgage Type
FHA
Purchase Details
Closed on
Oct 29, 2008
Sold by
Barragan Alberto and Peralta Nancy
Bought by
Deutsche Bank National Trust Company
Purchase Details
Closed on
Jun 15, 2004
Sold by
Haro Felix F and Haro Jolene
Bought by
Barragan Alberto and Peralta Nancy
Home Financials for this Owner
Home Financials are based on the most recent Mortgage that was taken out on this home.
Original Mortgage
$280,000
Interest Rate
5.35%
Mortgage Type
Purchase Money Mortgage
Purchase Details
Closed on
Feb 25, 2003
Sold by
Haro Jolene
Bought by
Haro Felix F
Home Financials for this Owner
Home Financials are based on the most recent Mortgage that was taken out on this home.
Original Mortgage
$125,000
Interest Rate
5.93%
Mortgage Type
Purchase Money Mortgage
Create a Home Valuation Report for This Property
The Home Valuation Report is an in-depth analysis detailing your home's value as well as a comparison with similar homes in the area
Home Values in the Area
Average Home Value in this Area
Purchase History
We collect this data history from publicly available records. To have your information removed, we recommend requesting removal directly through your county’s website.
| Date | Buyer | Sale Price | Title Company |
|---|---|---|---|
| Xu Lejun | $343,500 | Chicago Title Company | |
| Jain Roop | $275,000 | First American Title Company | |
| Elliott Kristi | -- | Old Republic Title Company | |
| Elliott Kristi A | $110,000 | Lsi Title Company | |
| Deutsche Bank National Trust Company | $144,500 | Accommodation | |
| Barragan Alberto | $350,000 | New Century Title | |
| Haro Felix F | -- | First American Title | |
| Haro Felix F | -- | First American Title |
Source: Public Records
Mortgage History
We collect this data history from publicly available records. To have your information removed, we recommend requesting removal directly through your county’s website.
| Date | Status | Borrower | Loan Amount |
|---|---|---|---|
| Open | Xu Lejun | $274,800 | |
| Previous Owner | Elliott Kristi | $206,250 | |
| Previous Owner | Elliott Kristi A | $108,007 | |
| Previous Owner | Barragan Alberto | $280,000 | |
| Previous Owner | Haro Felix F | $125,000 | |
| Closed | Barragan Alberto | $70,000 |
Source: Public Records
Tax History
| Year | Tax Paid | Tax Assessment Tax Assessment Total Assessment is a certain percentage of the fair market value that is determined by local assessors to be the total taxable value of land and additions on the property. | Land | Improvement |
|---|---|---|---|---|
| 2025 | $4,783 | $383,176 | $195,213 | $187,963 |
| 2024 | $4,540 | $375,664 | $191,386 | $184,278 |
| 2023 | $4,540 | $368,299 | $187,634 | $180,665 |
| 2022 | $4,469 | $361,078 | $183,955 | $177,123 |
| 2021 | $4,292 | $353,999 | $180,349 | $173,650 |
| 2019 | $4,113 | $325,000 | $200,000 | $125,000 |
| 2018 | $1,816 | $124,486 | $56,584 | $67,902 |
| 2017 | $1,764 | $122,046 | $55,475 | $66,571 |
| 2016 | $1,711 | $119,654 | $54,388 | $65,266 |
| 2015 | $1,686 | $117,858 | $53,572 | $64,286 |
| 2014 | $1,632 | $115,550 | $52,523 | $63,027 |
Source: Public Records
Map
Nearby Homes
Your Personal Tour Guide
Ask me questions while you tour the home.