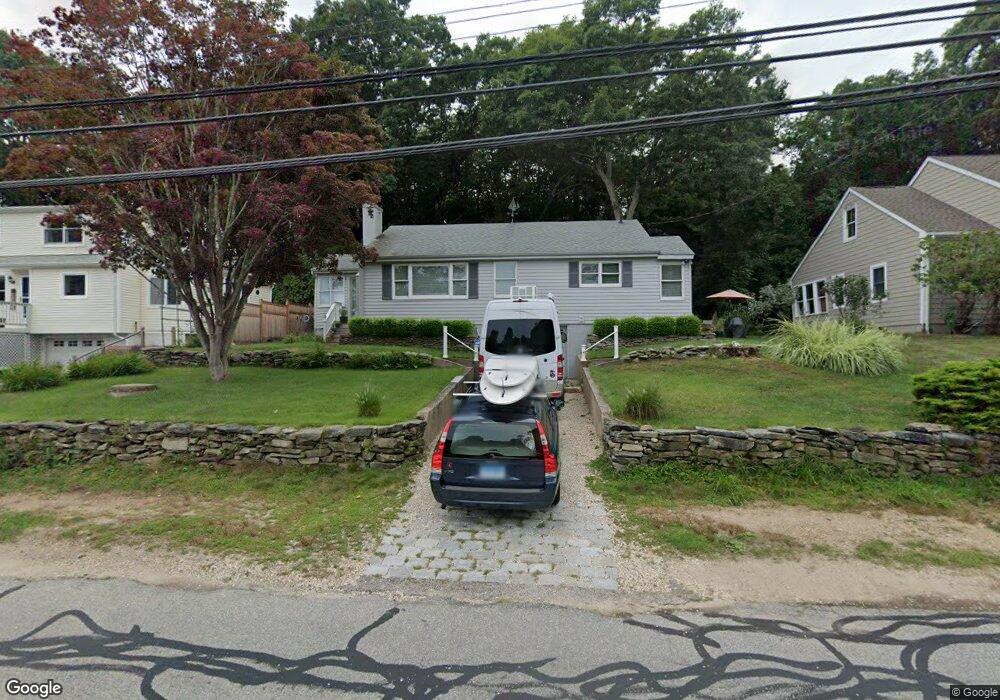
39 W End Ave Niantic, CT 06357
Estimated Value: $488,000 - $635,000
3
Beds
1
Bath
1,180
Sq Ft
$483/Sq Ft
Est. Value
About This Home
This home is located at 39 W End Ave, Niantic, CT 06357 and is currently estimated at $569,390, approximately $482 per square foot. 39 W End Ave is a home located in New London County with nearby schools including East Lyme Middle School, East Lyme High School, and The Light House Voc-Ed Center.
Ownership History
Date
Name
Owned For
Owner Type
Purchase Details
Closed on
Jul 1, 1999
Sold by
Cramer Jay M
Bought by
Higgins David
Current Estimated Value
Home Financials for this Owner
Home Financials are based on the most recent Mortgage that was taken out on this home.
Original Mortgage
$103,900
Interest Rate
7.38%
Purchase Details
Closed on
Jan 6, 1989
Sold by
Berger Marc
Bought by
Green Carole
Create a Home Valuation Report for This Property
The Home Valuation Report is an in-depth analysis detailing your home's value as well as a comparison with similar homes in the area
Home Values in the Area
Average Home Value in this Area
Purchase History
| Date | Buyer | Sale Price | Title Company |
|---|---|---|---|
| Higgins David | $129,900 | -- | |
| Green Carole | $155,000 | -- |
Source: Public Records
Mortgage History
| Date | Status | Borrower | Loan Amount |
|---|---|---|---|
| Closed | Green Carole | $90,000 | |
| Closed | Green Carole | $103,900 | |
| Previous Owner | Green Carole | $100,000 | |
| Previous Owner | Green Carole | $50,000 |
Source: Public Records
Tax History Compared to Growth
Tax History
| Year | Tax Paid | Tax Assessment Tax Assessment Total Assessment is a certain percentage of the fair market value that is determined by local assessors to be the total taxable value of land and additions on the property. | Land | Improvement |
|---|---|---|---|---|
| 2025 | $6,923 | $247,170 | $139,370 | $107,800 |
| 2024 | $6,513 | $247,170 | $139,370 | $107,800 |
| 2023 | $6,150 | $247,170 | $139,370 | $107,800 |
| 2022 | $5,893 | $247,170 | $139,370 | $107,800 |
| 2021 | $5,323 | $186,690 | $120,820 | $65,870 |
| 2020 | $5,295 | $186,690 | $120,820 | $65,870 |
| 2019 | $5,263 | $186,690 | $120,820 | $65,870 |
| 2018 | $5,106 | $186,690 | $120,820 | $65,870 |
| 2017 | $4,884 | $186,690 | $120,820 | $65,870 |
| 2016 | $4,628 | $182,490 | $120,820 | $61,670 |
| 2015 | $4,509 | $182,490 | $120,820 | $61,670 |
| 2014 | $4,385 | $182,490 | $120,820 | $61,670 |
Source: Public Records
Map
Nearby Homes
- 43 Attawan Ave
- 48 Billow Rd
- 5 Attawan Ave
- 11 Sunset Ave
- 7 Old Black Point Rd
- 146 Black Point Rd
- 46 Old Black Point Rd
- 127 Black Point Rd Unit 7
- 23 Central Ave
- 61 Terrace Ave
- 68-70 Black Point Rd
- 15 Griswold Rd
- 9 Columbus Ave
- 40 Spinnaker Dr
- 43 Village Crossing Unit 43
- 223 Giants Neck Rd
- 47 Village Crossing Unit 47
- 3 Village Crossing Unit 3
- 78 Corey Ln Unit 9
- 46 Village Crossing Unit 46