
Seller's Agent in 2025
Caroline Farnsworth
COLDWELL BANKER REALTY
(973) 761-8486
2 in this area
79 Total Sales
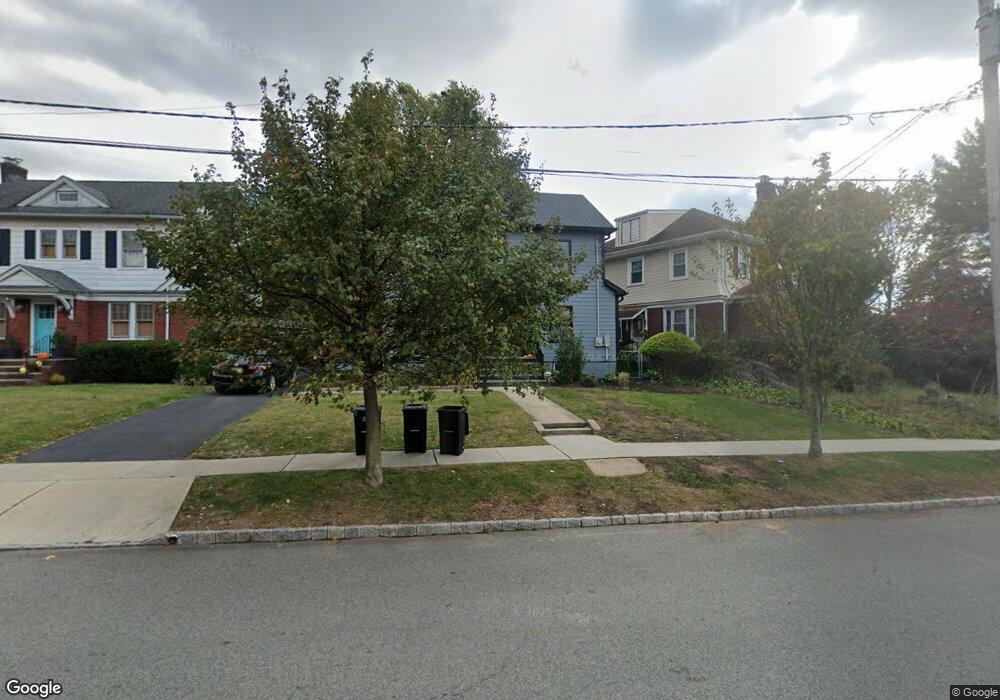
This home is located at 39 Walnut Crescent, Montclair, NJ 07042 and is currently priced at $1,417,200, approximately $936 per square foot. This property was built in 1925. 39 Walnut Crescent is a home located in Essex County with nearby schools including Hillside School, Nishuane School, and Bradford School.
Last Agent to Sell the Property
COLDWELL BANKER REALTY Brokerage Phone: 973-378-8300 Listed on: 05/29/2025
Last Buyer's Agent
COLDWELL BANKER REALTY Brokerage Phone: 973-378-8300 Listed on: 05/29/2025
| Date | Type | Sale Price | Title Company |
|---|---|---|---|
| Deed | $1,417,200 | Ridge Title | |
| Deed | $750,000 | Shepherd Title | |
| Deed | $575,000 | American Land Title | |
| Deed | $575,000 | American Land Title | |
| Deed | -- | None Listed On Document |
| Date | Status | Loan Amount | Loan Type |
|---|---|---|---|
| Open | $1,265,011 | New Conventional | |
| Previous Owner | $974,970 | Construction |
| Date | Event | Price | List to Sale | Price per Sq Ft |
|---|---|---|---|---|
| 07/21/2025 07/21/25 | Sold | $1,417,200 | +23.2% | $936 / Sq Ft |
| 06/19/2025 06/19/25 | Pending | -- | -- | -- |
| 06/02/2025 06/02/25 | For Sale | $1,150,000 | -- | $760 / Sq Ft |
| Year | Tax Paid | Tax Assessment Tax Assessment Total Assessment is a certain percentage of the fair market value that is determined by local assessors to be the total taxable value of land and additions on the property. | Land | Improvement |
|---|---|---|---|---|
| 2025 | $11,353 | $335,900 | $327,500 | $8,400 |
| 2024 | $11,353 | $335,900 | $327,500 | $8,400 |
| 2022 | $11,044 | $335,900 | $327,500 | $8,400 |
| 2021 | $10,853 | $335,900 | $327,500 | $8,400 |
| 2020 | $15,518 | $496,000 | $327,500 | $168,500 |
| 2019 | $15,354 | $496,000 | $327,500 | $168,500 |
| 2018 | $15,096 | $496,000 | $327,500 | $168,500 |
| 2017 | $11,288 | $309,000 | $178,500 | $130,500 |
| 2016 | $10,979 | $309,000 | $178,500 | $130,500 |
| 2015 | $10,645 | $309,000 | $178,500 | $130,500 |
| 2014 | $10,281 | $309,000 | $178,500 | $130,500 |
Seller's Agent in 2025
Caroline Farnsworth
COLDWELL BANKER REALTY
(973) 761-8486
2 in this area
79 Total Sales
Source: Garden State MLS
MLS Number: 3966106
APN: 13-04309-0000-00005
Disclaimer: Certain information contained herein is derived from information provided by parties other than Homes.com. All information provided is deemed reliable, but is not guaranteed to be accurate and should be independently verified.
![]() The data relating to real estate for sale on this website comes in part from the IDX Program of Garden State Multiple Listing Service, L.L.C. Real estate listings held by other brokerage firms are marked as IDX Listing.
The data relating to real estate for sale on this website comes in part from the IDX Program of Garden State Multiple Listing Service, L.L.C. Real estate listings held by other brokerage firms are marked as IDX Listing.
Information deemed reliable but not guaranteed.
Copyright © 2026 Garden State Multiple Listing Service, L.L.C. All rights reserved.
Notice: The dissemination of listings on this website does not constitute the consent required by N.J.A.C. 11:5.6.1 (n) for the advertisement of listings exclusively for sale by another broker. Any such consent must be obtained in writing from the listing broker.
This information is being provided for Consumers’ personal, non-commercial use and may not be used for any purpose other than to identify prospective properties Consumers may be interested in purchasing.
Ask me questions while you tour the home.