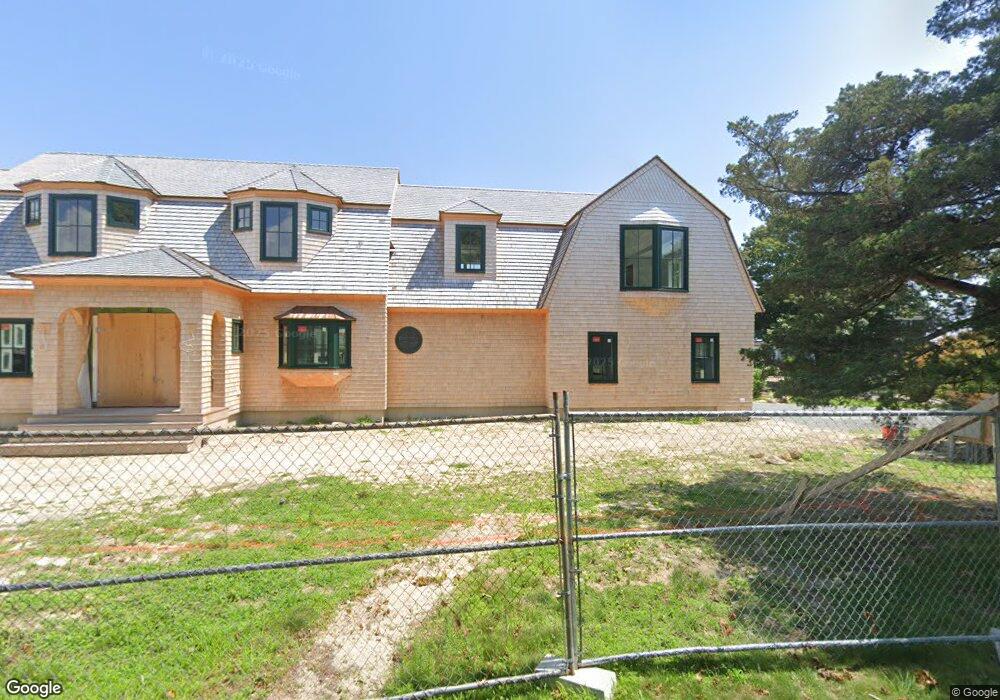
39 Water St Marion, MA 02738
Marion Center NeighborhoodEstimated Value: $1,147,000 - $3,744,000
3
Beds
2
Baths
2,295
Sq Ft
$1,130/Sq Ft
Est. Value
About This Home
This home is located at 39 Water St, Marion, MA 02738 and is currently estimated at $2,592,435, approximately $1,129 per square foot. 39 Water St is a home located in Plymouth County with nearby schools including Old Rochester Regional High School and Tabor Academy.
Ownership History
Date
Name
Owned For
Owner Type
Purchase Details
Closed on
Sep 27, 2019
Sold by
Kendall John P
Bought by
John P Kendall T P and John Kendall
Current Estimated Value
Purchase Details
Closed on
Oct 13, 2010
Sold by
Babbitt Ft and Babbitt-Grainger
Bought by
Kendall John P
Home Financials for this Owner
Home Financials are based on the most recent Mortgage that was taken out on this home.
Original Mortgage
$1,750,000
Interest Rate
4.36%
Mortgage Type
Purchase Money Mortgage
Create a Home Valuation Report for This Property
The Home Valuation Report is an in-depth analysis detailing your home's value as well as a comparison with similar homes in the area
Home Values in the Area
Average Home Value in this Area
Purchase History
| Date | Buyer | Sale Price | Title Company |
|---|---|---|---|
| John P Kendall T P | -- | -- | |
| Kendall John P | $2,500,000 | -- |
Source: Public Records
Mortgage History
| Date | Status | Borrower | Loan Amount |
|---|---|---|---|
| Previous Owner | Kendall John P | $1,750,000 |
Source: Public Records
Tax History
| Year | Tax Paid | Tax Assessment Tax Assessment Total Assessment is a certain percentage of the fair market value that is determined by local assessors to be the total taxable value of land and additions on the property. | Land | Improvement |
|---|---|---|---|---|
| 2025 | $28,941 | $3,105,306 | $2,628,506 | $476,800 |
| 2024 | $32,326 | $3,490,965 | $3,026,765 | $464,200 |
| 2023 | $31,043 | $3,288,411 | $2,858,611 | $429,800 |
| 2022 | $27,619 | $2,545,525 | $2,127,525 | $418,000 |
| 2021 | $25,725 | $2,272,523 | $1,876,423 | $396,100 |
| 2020 | $26,402 | $2,256,600 | $1,876,200 | $380,400 |
| 2019 | $24,890 | $2,256,600 | $1,876,200 | $380,400 |
| 2018 | $25,492 | $2,226,400 | $1,860,200 | $366,200 |
| 2017 | $25,242 | $2,212,300 | $1,860,200 | $352,100 |
| 2016 | $24,842 | $2,196,500 | $1,860,200 | $336,300 |
| 2015 | $24,716 | $2,224,700 | $1,860,200 | $364,500 |
Source: Public Records
Map
Nearby Homes
- 8 Vine St
- 16 Vine St
- 0 Old Trail Unit 73463401
- 13 Cottage St
- 701 Mill St
- 7 Upland Way
- 4 Olde Logging Rd
- 15 Quelle Ln
- 25 West Ave
- 414 Point Rd
- 13 Converse Rd
- 0 Register Rd
- 44 Register Rd
- 5 Hermitage Rd
- 2 Quelle Ln
- 143 Cross Neck Rd
- 38 Rocky Knook Ln
- 13 Fieldstone Ln
- 4 Edwards Bridge Rd
- 17 Fieldstone Ln