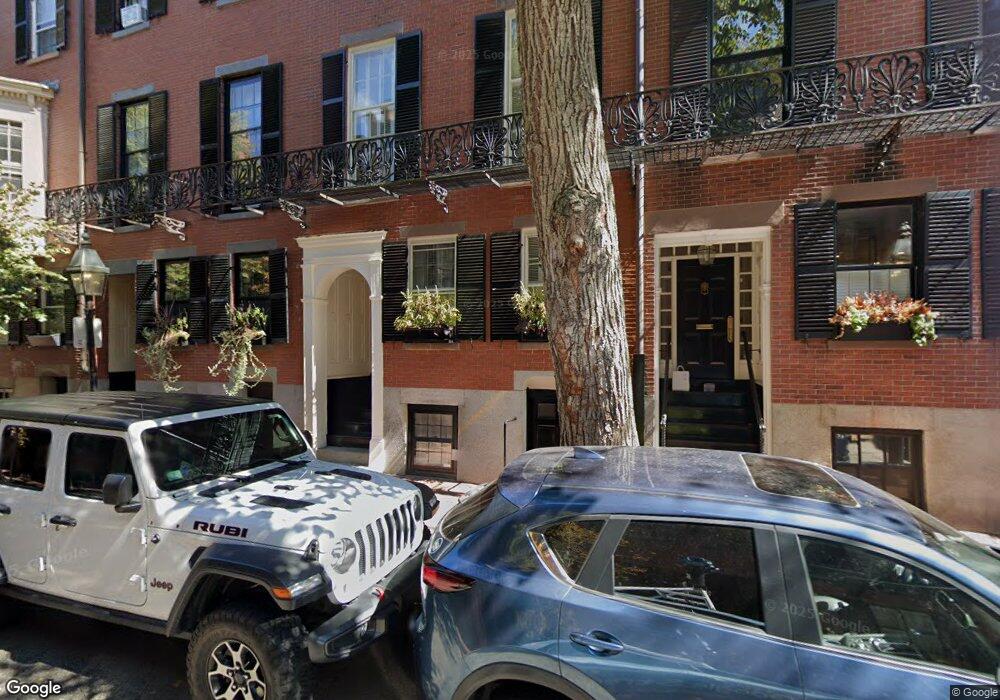
39 West Cedar St Boston, MA 02114
Beacon Hill NeighborhoodEstimated Value: $3,835,806 - $4,414,000
3
Beds
5
Baths
2,768
Sq Ft
$1,480/Sq Ft
Est. Value
About This Home
This home is located at 39 West Cedar St, Boston, MA 02114 and is currently estimated at $4,097,935, approximately $1,480 per square foot. 39 West Cedar St is a home located in Suffolk County with nearby schools including Advent School, Torit Montessori School, and Park Street School.
Ownership History
Date
Name
Owned For
Owner Type
Purchase Details
Closed on
Nov 15, 2023
Sold by
Minton Therese S
Bought by
39 West Cedar Llc
Current Estimated Value
Purchase Details
Closed on
Jan 12, 1989
Sold by
Stratouly Dean F
Bought by
Minton Robert S
Home Financials for this Owner
Home Financials are based on the most recent Mortgage that was taken out on this home.
Original Mortgage
$1,000,000
Interest Rate
10.39%
Mortgage Type
Purchase Money Mortgage
Create a Home Valuation Report for This Property
The Home Valuation Report is an in-depth analysis detailing your home's value as well as a comparison with similar homes in the area
Home Values in the Area
Average Home Value in this Area
Purchase History
| Date | Buyer | Sale Price | Title Company |
|---|---|---|---|
| 39 West Cedar Llc | -- | None Available | |
| Minton Robert S | $1,500,000 | -- |
Source: Public Records
Mortgage History
| Date | Status | Borrower | Loan Amount |
|---|---|---|---|
| Previous Owner | Minton Robert S | $1,000,000 |
Source: Public Records
Tax History
| Year | Tax Paid | Tax Assessment Tax Assessment Total Assessment is a certain percentage of the fair market value that is determined by local assessors to be the total taxable value of land and additions on the property. | Land | Improvement |
|---|---|---|---|---|
| 2025 | $42,247 | $3,648,300 | $1,578,300 | $2,070,000 |
| 2024 | $40,552 | $3,720,400 | $1,491,300 | $2,229,100 |
| 2023 | $39,957 | $3,720,400 | $1,491,300 | $2,229,100 |
| 2022 | $37,991 | $3,491,800 | $1,420,300 | $2,071,500 |
| 2021 | $36,527 | $3,423,300 | $1,392,400 | $2,030,900 |
| 2020 | $35,058 | $3,319,900 | $1,183,300 | $2,136,600 |
| 2019 | $33,318 | $3,161,100 | $971,400 | $2,189,700 |
| 2018 | $30,973 | $2,955,400 | $971,400 | $1,984,000 |
| 2017 | $29,808 | $2,814,700 | $971,400 | $1,843,300 |
| 2016 | $29,770 | $2,706,400 | $971,400 | $1,735,000 |
| 2015 | $30,073 | $2,483,300 | $855,900 | $1,627,400 |
| 2014 | $29,753 | $2,365,100 | $855,900 | $1,509,200 |
Source: Public Records
Map
Nearby Homes
- 75 Charles St Unit 4B (Apt 3)
- 102 Charles St Unit C
- 100 Charles St Unit 3
- 121 Pinckney St
- 15 W Cedar St
- 120 Charles St
- 145 Pinckney Street Concierge Bldg Unit 603-605
- 22 Brimmer St
- 102 Revere St
- 49 Charles St
- 11 W Cedar St
- 59 W Cedar St Unit 6
- 81 Pinckney St
- 90 Mount Vernon St
- 6 Goodwin Place Unit B
- 6 Goodwin Place Unit 4
- 32 Lime St
- 82 Chestnut St Unit 30
- 86 Mount Vernon St
- 6 W Hill Place
- 37 West Cedar St
- 41 West Cedar St
- 35 W Cedar St
- 37 W Cedar St
- 43 West Cedar St
- 35 West Cedar St
- 33 West Cedar St
- 45 West Cedar St
- 45 W Cedar St
- 92 Revere St Unit 3
- 92 Revere St Unit 2
- 92 Revere St
- 92 Revere St Unit 1
- 92 Revere St Unit 4
- 136 Myrtle St Unit T1
- 136 Myrtle St Unit 2
- 136 Myrtle St Unit 3
- 135 Myrtle St
- 105 Pinckney St Unit 8
- 105 Pinckney St Unit 4
Your Personal Tour Guide
Ask me questions while you tour the home.