39 Whitworth St Enfield, CT 06082
Estimated Value: $187,000 - $241,000
3
Beds
6
Baths
1,191
Sq Ft
$184/Sq Ft
Est. Value
About This Home
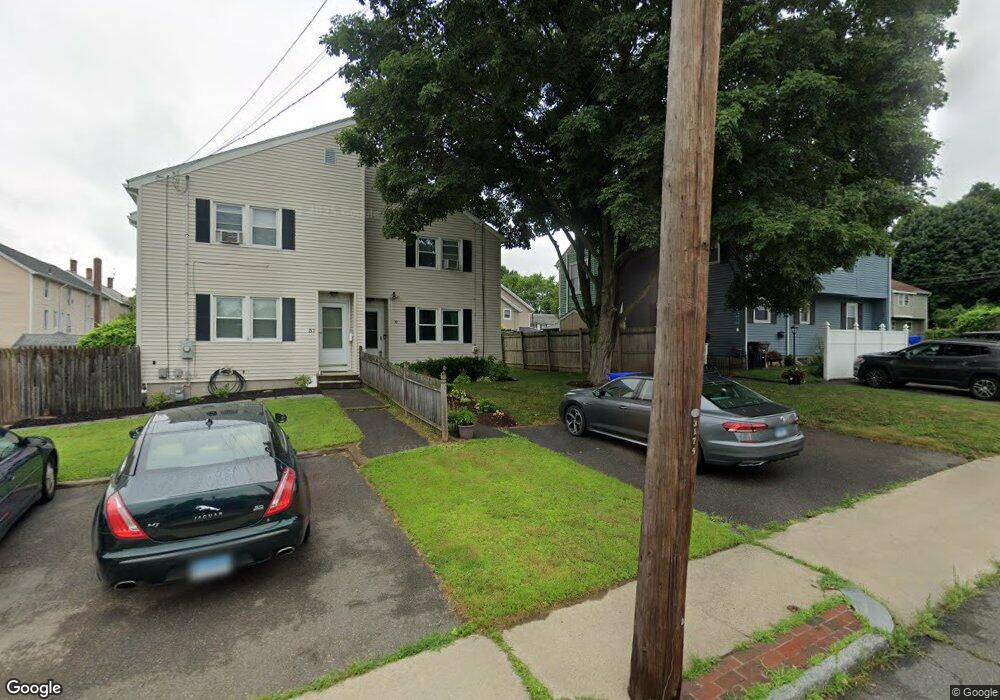
This home is located at 39 Whitworth St, Enfield, CT 06082 and is currently estimated at $219,449, approximately $184 per square foot. 39 Whitworth St is a home located in Hartford County with nearby schools including Henry Barnard Elementary School, Prudence Crandall Elementary School, and John F. Kennedy Middle School.
Ownership History
Date
Name
Owned For
Owner Type
Purchase Details
Closed on
Dec 23, 2010
Sold by
Sterling Invst Props L
Bought by
Diffley Christine L
Current Estimated Value
Home Financials for this Owner
Home Financials are based on the most recent Mortgage that was taken out on this home.
Original Mortgage
$20,000
Interest Rate
5.38%
Purchase Details
Closed on
Sep 15, 2010
Sold by
Hsbc Bank Usa
Bought by
Sterling Inv Prop Llc
Home Financials for this Owner
Home Financials are based on the most recent Mortgage that was taken out on this home.
Original Mortgage
$44,000
Interest Rate
12%
Purchase Details
Closed on
Apr 28, 2010
Sold by
Therrien Paul R
Bought by
Hsbc Bank Usa
Purchase Details
Closed on
Apr 25, 2005
Sold by
Goss Lynne and Goss Dennis
Bought by
Therrien Paul
Purchase Details
Closed on
Mar 31, 1989
Sold by
Jennings Ritamay
Bought by
Goss Lynne
Create a Home Valuation Report for This Property
The Home Valuation Report is an in-depth analysis detailing your home's value as well as a comparison with similar homes in the area
Home Values in the Area
Average Home Value in this Area
Purchase History
| Date | Buyer | Sale Price | Title Company |
|---|---|---|---|
| Diffley Christine L | $105,000 | -- | |
| Sterling Inv Prop Llc | $45,000 | -- | |
| Hsbc Bank Usa | $103,411 | -- | |
| Therrien Paul | $101,000 | -- | |
| Goss Lynne | $101,000 | -- |
Source: Public Records
Mortgage History
| Date | Status | Borrower | Loan Amount |
|---|---|---|---|
| Closed | Goss Lynne | $20,000 | |
| Open | Goss Lynne | $84,000 | |
| Previous Owner | Goss Lynne | $44,000 |
Source: Public Records
Tax History Compared to Growth
Tax History
| Year | Tax Paid | Tax Assessment Tax Assessment Total Assessment is a certain percentage of the fair market value that is determined by local assessors to be the total taxable value of land and additions on the property. | Land | Improvement |
|---|---|---|---|---|
| 2025 | $3,264 | $87,500 | $32,200 | $55,300 |
| 2024 | $3,176 | $87,500 | $32,200 | $55,300 |
| 2023 | $3,176 | $87,500 | $32,200 | $55,300 |
| 2022 | $2,943 | $87,500 | $32,200 | $55,300 |
| 2021 | $2,839 | $69,100 | $26,640 | $42,460 |
| 2020 | $2,812 | $69,100 | $26,640 | $42,460 |
| 2019 | $2,834 | $69,100 | $26,640 | $42,460 |
| 2018 | $2,773 | $69,100 | $26,640 | $42,460 |
| 2017 | $2,748 | $69,100 | $26,640 | $42,460 |
| 2016 | $2,667 | $68,030 | $26,640 | $41,390 |
| 2015 | $2,601 | $68,030 | $26,640 | $41,390 |
| 2014 | $2,475 | $68,030 | $26,640 | $41,390 |
Source: Public Records
Map
Nearby Homes