D
Landlord's Agent in 2018
Dena Friedman_Parisot
Keller Williams Realty Boston-Metro | Back Bay
Estimated Value: $837,000 - $913,000
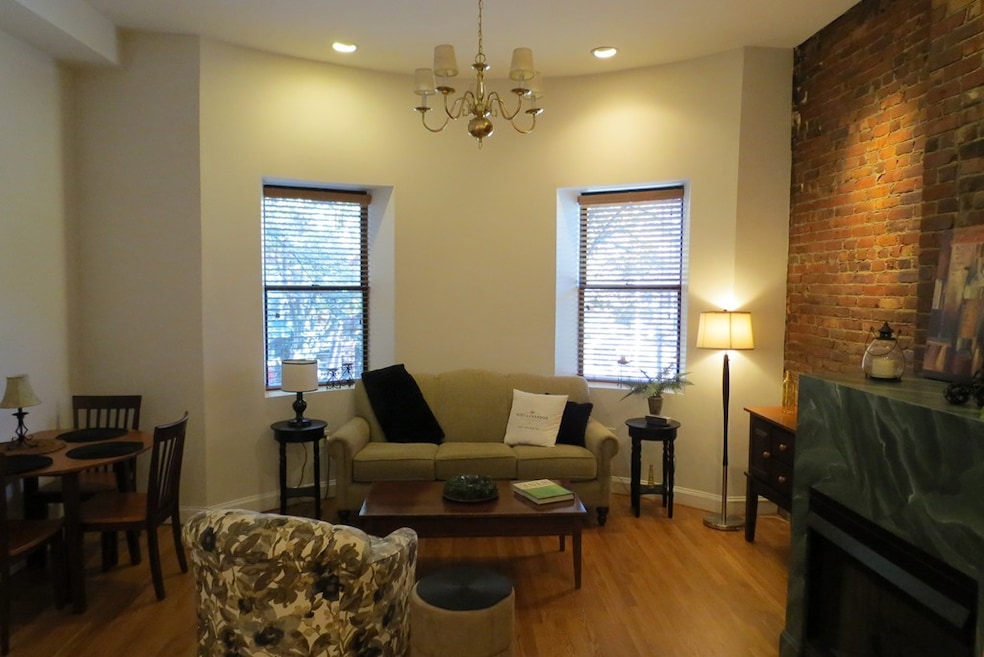
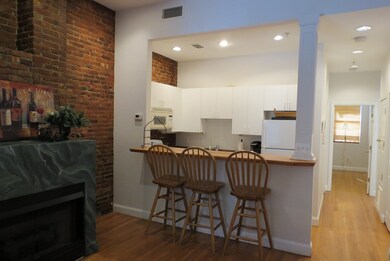
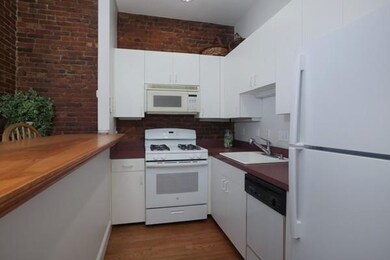
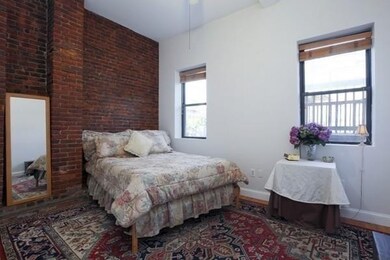
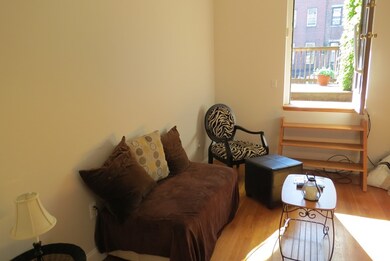
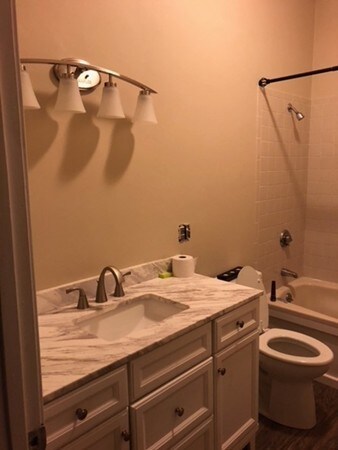
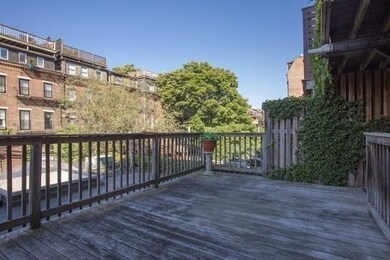
Beautiful, sunny and spacious two bed rental w/huge private deck in historic brownstone. Open living area with fireplace. In unit washer/dryer, brand new kitchen and bathroom, great storage space, central a/c, hardwood floors throughout and freshly painted. One half block from BU Medical/Dental on beautiful tree lined street in Boston's desirable South End. Close to all the great restaurants, shops and cafes in this trendy neighborhood. Just a short walk to Copley Place, Newbury Street, public garden and all the city has to offer. Easy access to all major highways and bus lines at the corner.
Last Agent to Rent the Property
Dena Friedman_Parisot
Keller Williams Realty Boston-Metro | Back Bay License #449538501 Listed on: 09/23/2017

Home Type
Condominium
Year Built
1920
Lot Details
741 Sq Ft Lot
| Date | Buyer | Sale Price | Title Company |
|---|---|---|---|
| Pare Allan R | $147,900 | -- |
| Date | Status | Borrower | Loan Amount |
|---|---|---|---|
| Open | Pare Allan R | $64,000 | |
| Open | Pare Allan R | $120,000 | |
| Closed | Pare Allan R | $125,000 |
| Date | Event | Price | List to Sale | Price per Sq Ft | Prior Sale |
|---|---|---|---|---|---|
| 03/02/2018 03/02/18 | Rented | $3,000 | -6.3% | -- | |
| 02/25/2018 02/25/18 | Under Contract | -- | -- | -- | |
| 01/08/2018 01/08/18 | For Rent | $3,200 | 0.0% | -- | |
| 12/31/2017 12/31/17 | Off Market | $3,200 | -- | -- | |
| 10/06/2017 10/06/17 | Sold | $635,000 | 0.0% | $864 / Sq Ft | View Prior Sale |
| 09/23/2017 09/23/17 | For Rent | $3,200 | 0.0% | -- | |
| 08/18/2017 08/18/17 | Pending | -- | -- | -- | |
| 08/10/2017 08/10/17 | For Sale | $659,000 | -- | $897 / Sq Ft |
| Year | Tax Paid | Tax Assessment Tax Assessment Total Assessment is a certain percentage of the fair market value that is determined by local assessors to be the total taxable value of land and additions on the property. | Land | Improvement |
|---|---|---|---|---|
| 2025 | $9,047 | $781,300 | $0 | $781,300 |
| 2024 | $8,301 | $761,600 | $0 | $761,600 |
| 2023 | $8,016 | $746,400 | $0 | $746,400 |
| 2022 | $8,042 | $739,200 | $0 | $739,200 |
| 2021 | $7,733 | $724,700 | $0 | $724,700 |
| 2020 | $7,692 | $728,400 | $0 | $728,400 |
| 2019 | $7,452 | $707,000 | $0 | $707,000 |
| 2018 | $6,686 | $638,000 | $0 | $638,000 |
| 2017 | $6,434 | $607,600 | $0 | $607,600 |
| 2016 | $6,426 | $584,200 | $0 | $584,200 |
| 2015 | $5,436 | $448,900 | $0 | $448,900 |
| 2014 | $5,125 | $407,400 | $0 | $407,400 |
D
Landlord's Agent in 2018
Dena Friedman_Parisot
Keller Williams Realty Boston-Metro | Back Bay
Tenant's Agent in 2018
Ethan Felleman
Gibson Sothebys International Realty
(617) 426-6900
5 in this area
14 Total Sales
F
Seller's Agent in 2017
Fine Homes Group
Keller Williams Realty Boston-Metro | Back Bay
(603) 556-7110
6 in this area
85 Total Sales
Source: MLS Property Information Network (MLS PIN)
MLS Number: 72233216
APN: CBOS-000000-000008-001523-000004
Disclaimer: Certain information contained herein is derived from information provided by parties other than Homes.com. All information provided is deemed reliable, but is not guaranteed to be accurate and should be independently verified.
![]() The property listing data and information, or the Images, set forth herein were provided to MLS Property Information Network, Inc. from third party sources, including sellers, lessors and public records, and were compiled by MLS Property Information Network, Inc. The property listing data and information, and the Images, are for the personal, non-commercial use of consumers having a good faith interest in purchasing or leasing listed properties of the type displayed to them and may not be used for any purpose other than to identify prospective properties which such consumers may have a good faith interest in purchasing or leasing. MLS Property Information Network, Inc. and its subscribers disclaim any and all representations and warranties as to the accuracy of the property listing data and information, or as to the accuracy of any of the Images, set forth herein.
The property listing data and information, or the Images, set forth herein were provided to MLS Property Information Network, Inc. from third party sources, including sellers, lessors and public records, and were compiled by MLS Property Information Network, Inc. The property listing data and information, and the Images, are for the personal, non-commercial use of consumers having a good faith interest in purchasing or leasing listed properties of the type displayed to them and may not be used for any purpose other than to identify prospective properties which such consumers may have a good faith interest in purchasing or leasing. MLS Property Information Network, Inc. and its subscribers disclaim any and all representations and warranties as to the accuracy of the property listing data and information, or as to the accuracy of any of the Images, set forth herein.
Ask me questions while you tour the home.