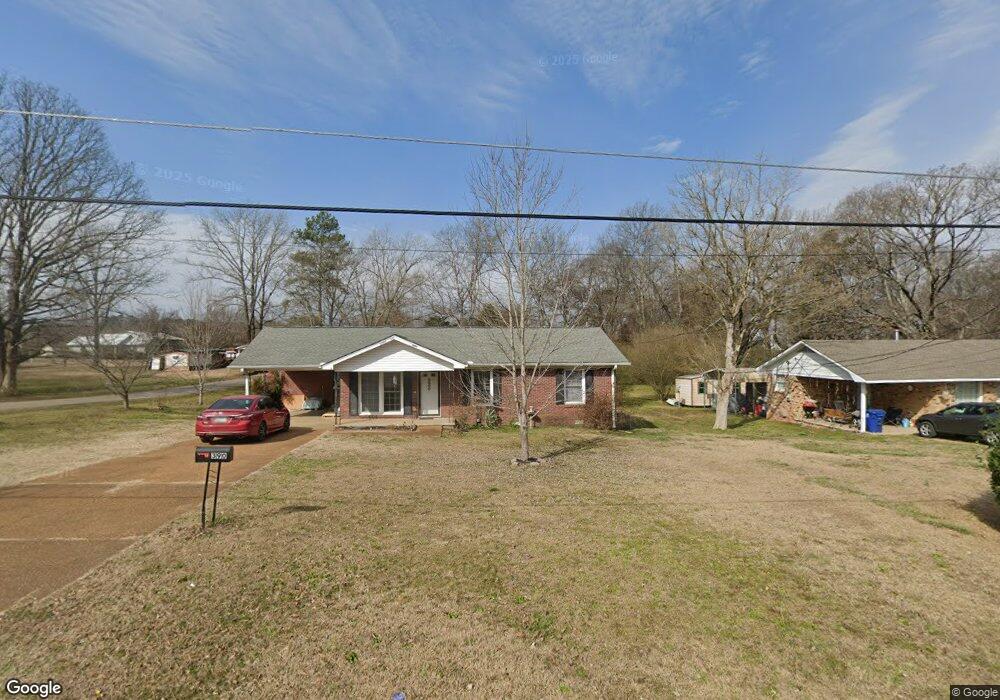
390 Bain Rd Savannah, TN 38372
Estimated Value: $122,629 - $142,000
--
Bed
1
Bath
1,142
Sq Ft
$118/Sq Ft
Est. Value
About This Home
This home is located at 390 Bain Rd, Savannah, TN 38372 and is currently estimated at $134,907, approximately $118 per square foot. 390 Bain Rd is a home located in Hardin County with nearby schools including Hardin County High School and Hardin County Christian School.
Ownership History
Date
Name
Owned For
Owner Type
Purchase Details
Closed on
Oct 4, 2019
Sold by
Gambrell Jeffery Paul
Bought by
Jarrett Angela R
Current Estimated Value
Home Financials for this Owner
Home Financials are based on the most recent Mortgage that was taken out on this home.
Original Mortgage
$75,882
Outstanding Balance
$66,340
Interest Rate
3.4%
Mortgage Type
New Conventional
Estimated Equity
$68,567
Purchase Details
Closed on
Jul 2, 1999
Sold by
Boxley Bobby
Bought by
Little Wally and Little Perline
Home Financials for this Owner
Home Financials are based on the most recent Mortgage that was taken out on this home.
Original Mortgage
$42,745
Interest Rate
7.43%
Purchase Details
Closed on
Oct 2, 1998
Sold by
Middleton Amanda F
Bought by
Boxley Bobby
Purchase Details
Closed on
Nov 24, 1992
Bought by
S A U
Purchase Details
Closed on
Jun 3, 1986
Bought by
Smith Penny D
Create a Home Valuation Report for This Property
The Home Valuation Report is an in-depth analysis detailing your home's value as well as a comparison with similar homes in the area
Home Values in the Area
Average Home Value in this Area
Purchase History
| Date | Buyer | Sale Price | Title Company |
|---|---|---|---|
| Jarrett Angela R | $74,200 | -- | |
| Little Wally | $40,000 | -- | |
| Boxley Bobby | $34,000 | -- | |
| S A U | -- | -- | |
| Smith Penny D | -- | -- |
Source: Public Records
Mortgage History
| Date | Status | Borrower | Loan Amount |
|---|---|---|---|
| Open | Jarrett Angela R | $75,882 | |
| Previous Owner | Smith Penny D | $42,745 |
Source: Public Records
Tax History Compared to Growth
Tax History
| Year | Tax Paid | Tax Assessment Tax Assessment Total Assessment is a certain percentage of the fair market value that is determined by local assessors to be the total taxable value of land and additions on the property. | Land | Improvement |
|---|---|---|---|---|
| 2024 | $752 | $30,675 | $1,925 | $28,750 |
| 2023 | $752 | $30,675 | $1,925 | $28,750 |
| 2022 | $411 | $14,900 | $1,925 | $12,975 |
| 2021 | $411 | $14,900 | $1,925 | $12,975 |
| 2020 | $399 | $14,900 | $1,925 | $12,975 |
| 2019 | $399 | $14,450 | $1,925 | $12,525 |
| 2018 | $389 | $14,450 | $1,925 | $12,525 |
| 2017 | $406 | $14,600 | $2,050 | $12,550 |
| 2016 | $406 | $14,600 | $2,050 | $12,550 |
| 2015 | $368 | $14,600 | $2,050 | $12,550 |
| 2014 | $368 | $14,600 | $2,050 | $12,550 |
Source: Public Records
Map
Nearby Homes
- 530 Stout St
- 250 Ranch St
- 7085 Cravens Rd
- 250 Parkview Dr
- 134 Vine St
- 295 Claybrook Dr
- 190 Turner Kyle Dr
- 70 Red Fern Cove
- 220 Chinkapin Cove
- 280 Meadowlane Dr
- 700 Harbert Dr
- 80 Northcutt St
- 0 High Pointe Dr Unit 10202679
- 6 High Pointe Dr
- 7 High Pointe Dr
- 25 Northcutt St
- 0 Pickwick St Unit 2501597
- 150 Eureka St
- 110 Eureka St
- 635 Harbert Dr
- 370 Bain Rd
- 0 Stout St Unit 10002277
- 0 Stout St Unit RTC3016519
- 0 Stout St Unit 10191609
- 0 Stout St Unit 10146511
- 0 Stout St Unit 10107050
- 0 Stout St Unit 10043991
- 310 Bain Rd
- 260 Stout St
- 260 Stout St
- 355 Bain Rd
- 357 Bain Rd
- 357 Bain Rd
- 350 Bain Rd
- 270 Stout St
- 195 Stout St
- 330 Bain Rd
- 185 Stout St
- 290 Stout St
- 325 Bain Rd