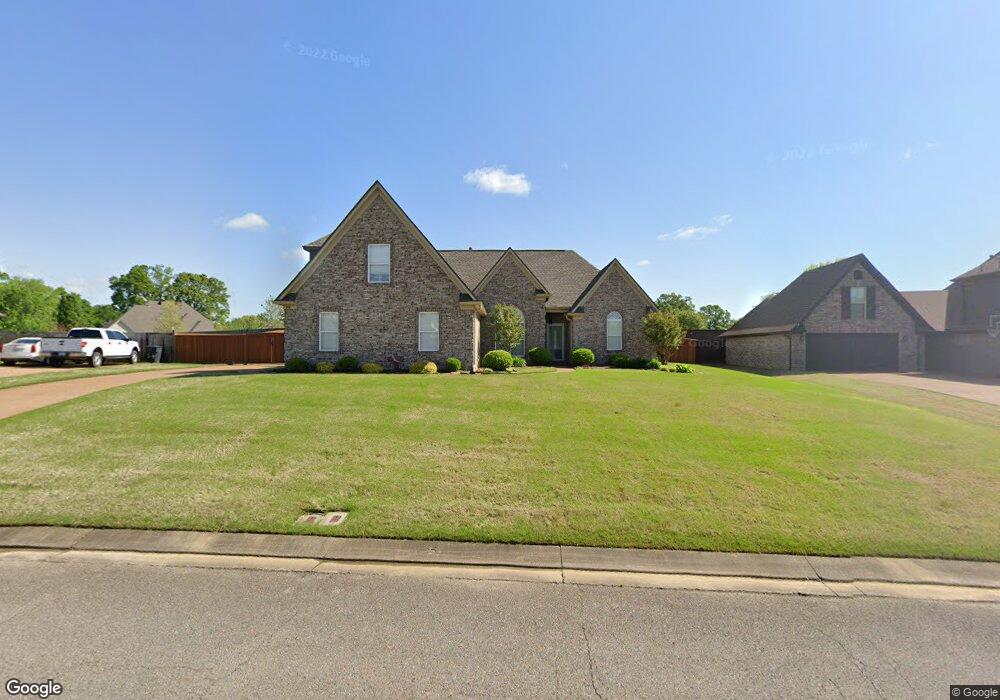
390 Blackankle Dr Oakland, TN 38060
Estimated Value: $377,922 - $394,000
5
Beds
2
Baths
2,300
Sq Ft
$168/Sq Ft
Est. Value
About This Home
This home is located at 390 Blackankle Dr, Oakland, TN 38060 and is currently estimated at $386,731, approximately $168 per square foot. 390 Blackankle Dr is a home located in Fayette County with nearby schools including Oakland Elementary School, West Junior High School, and Fayette Ware Comprehensive High School.
Ownership History
Date
Name
Owned For
Owner Type
Purchase Details
Closed on
Oct 10, 2018
Sold by
Caviness Pamela K and Sperling Marilyn S
Bought by
Caviness Pamela K and Sperling Marilyn S
Current Estimated Value
Purchase Details
Closed on
Mar 30, 2010
Sold by
Geneva Homes Inc
Bought by
Caviness Pamela K
Home Financials for this Owner
Home Financials are based on the most recent Mortgage that was taken out on this home.
Original Mortgage
$140,000
Outstanding Balance
$93,106
Interest Rate
4.97%
Estimated Equity
$293,625
Purchase Details
Closed on
Jan 29, 2010
Sold by
Ultra Homes Llc
Bought by
Geneva Homes Inc
Home Financials for this Owner
Home Financials are based on the most recent Mortgage that was taken out on this home.
Original Mortgage
$140,000
Outstanding Balance
$93,106
Interest Rate
4.97%
Estimated Equity
$293,625
Purchase Details
Closed on
Jun 6, 2007
Bought by
Ultra Homes Llc
Create a Home Valuation Report for This Property
The Home Valuation Report is an in-depth analysis detailing your home's value as well as a comparison with similar homes in the area
Home Values in the Area
Average Home Value in this Area
Purchase History
| Date | Buyer | Sale Price | Title Company |
|---|---|---|---|
| Caviness Pamela K | -- | Quality Title Group Llc | |
| Caviness Pamela K | $200,000 | -- | |
| Caviness Pamela K | $200,000 | -- | |
| Geneva Homes Inc | $52,000 | -- | |
| Geneva Homes Inc | $52,000 | -- | |
| Ultra Homes Llc | $520,000 | -- |
Source: Public Records
Mortgage History
| Date | Status | Borrower | Loan Amount |
|---|---|---|---|
| Open | Caviness Pamela K | $140,000 |
Source: Public Records
Tax History Compared to Growth
Tax History
| Year | Tax Paid | Tax Assessment Tax Assessment Total Assessment is a certain percentage of the fair market value that is determined by local assessors to be the total taxable value of land and additions on the property. | Land | Improvement |
|---|---|---|---|---|
| 2024 | $1,630 | $63,125 | $10,000 | $53,125 |
| 2023 | $1,630 | $63,125 | $0 | $0 |
| 2022 | $1,081 | $63,125 | $10,000 | $53,125 |
| 2021 | $1,081 | $63,125 | $10,000 | $53,125 |
| 2020 | $819 | $63,125 | $10,000 | $53,125 |
| 2019 | $1,103 | $54,350 | $8,750 | $45,600 |
| 2018 | $1,134 | $54,350 | $8,750 | $45,600 |
| 2017 | $967 | $54,350 | $8,750 | $45,600 |
| 2016 | $955 | $50,175 | $8,750 | $41,425 |
| 2015 | $955 | $50,175 | $8,750 | $41,425 |
| 2014 | $955 | $50,175 | $8,750 | $41,425 |
Source: Public Records
Map
Nearby Homes
- 245 Kipling Dr
- 15 Charter Cove
- 5 Northern Leaf Dr
- 210 Highland Park Dr
- 255 Highland Park Cove
- Lacombe Plan at Village Park
- Kenner Plan at Village Park
- 25 Kipling Dr
- Bristol Plan at Village Park
- Cameron Plan at Village Park
- 445 Windemere Loop
- 230 Kipling Dr
- 210 Kipling Dr
- 240 Kipling Dr Unit 171
- 12.79 AC Wirt Rd
- 230 Driftwood Loop
- 0 Hicks Rd
- 305 Driftwood Loop
- 65 Bentgrass Cove
- 100 Pine Valley Dr
- 370 Blackankle Dr
- 410 Blackankle Dr
- 405 Black Ankle Dr
- 405 Blackankle Dr
- 430 Blackankle Dr
- 340 Blackankle Dr
- 375 Blackankle Dr
- 435 Black Ankle Dr
- 435 Blackankle Dr
- 95 White Pine Place
- 75 White Pine Place
- 345 Black Ankle Dr
- 100 Sugar Maple Cove
- 345 Blackankle Dr
- 70 Sugar Maple Cove
- 450 Blackankle Dr
- 50 Sugar Maple Cove
- 450 Black Ankle Dr
- 45 White Pine Place
- 320 Blackankle Dr