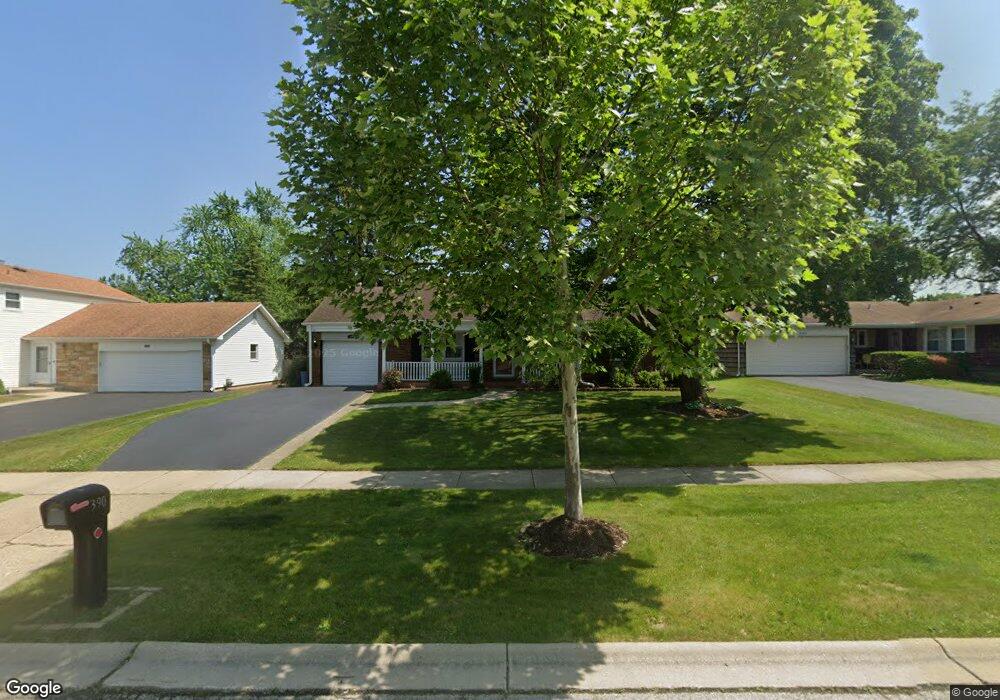
390 Checker Dr Unit 5 Buffalo Grove, IL 60089
Estimated Value: $393,000 - $419,000
3
Beds
2
Baths
1,176
Sq Ft
$346/Sq Ft
Est. Value
About This Home
This home is located at 390 Checker Dr Unit 5, Buffalo Grove, IL 60089 and is currently estimated at $406,345, approximately $345 per square foot. 390 Checker Dr Unit 5 is a home located in Lake County with nearby schools including Ivy Hall Elementary School, Twin Groves Middle School, and Adlai E Stevenson High School.
Ownership History
Date
Name
Owned For
Owner Type
Purchase Details
Closed on
May 4, 2017
Sold by
Eric N Ziemann
Bought by
Palanivel Sivanathan
Current Estimated Value
Home Financials for this Owner
Home Financials are based on the most recent Mortgage that was taken out on this home.
Original Mortgage
$228,650
Outstanding Balance
$189,732
Interest Rate
4.02%
Estimated Equity
$216,613
Purchase Details
Closed on
May 26, 2011
Sold by
Chicago Title Land Trust Company
Bought by
Ottinger Jaime L and Ziemann Eric N
Home Financials for this Owner
Home Financials are based on the most recent Mortgage that was taken out on this home.
Original Mortgage
$201,495
Interest Rate
5.25%
Mortgage Type
FHA
Purchase Details
Closed on
Apr 22, 2002
Sold by
Winner Lawrence and Winner Bruce
Bought by
Chicago Title Land Trust Company and Trust #1110799
Create a Home Valuation Report for This Property
The Home Valuation Report is an in-depth analysis detailing your home's value as well as a comparison with similar homes in the area
Home Values in the Area
Average Home Value in this Area
Purchase History
| Date | Buyer | Sale Price | Title Company |
|---|---|---|---|
| Palanivel Sivanathan | -- | -- | |
| Ottinger Jaime L | $210,000 | None Available | |
| Chicago Title Land Trust Company | -- | -- |
Source: Public Records
Mortgage History
| Date | Status | Borrower | Loan Amount |
|---|---|---|---|
| Open | Palanivel Sivanathan | $228,650 | |
| Closed | Palanivel Sivanathan | -- | |
| Previous Owner | Ottinger Jaime L | $201,495 |
Source: Public Records
Tax History Compared to Growth
Tax History
| Year | Tax Paid | Tax Assessment Tax Assessment Total Assessment is a certain percentage of the fair market value that is determined by local assessors to be the total taxable value of land and additions on the property. | Land | Improvement |
|---|---|---|---|---|
| 2024 | $8,791 | $99,309 | $33,539 | $65,770 |
| 2023 | $7,988 | $93,706 | $31,647 | $62,059 |
| 2022 | $7,988 | $82,603 | $27,897 | $54,706 |
| 2021 | $7,682 | $81,712 | $27,596 | $54,116 |
| 2020 | $7,502 | $81,991 | $27,690 | $54,301 |
| 2019 | $7,401 | $81,689 | $27,588 | $54,101 |
| 2018 | $7,272 | $82,797 | $27,265 | $55,532 |
| 2017 | $7,132 | $80,865 | $26,629 | $54,236 |
| 2016 | $6,936 | $77,434 | $25,499 | $51,935 |
| 2015 | $6,737 | $72,415 | $23,846 | $48,569 |
| 2014 | $6,376 | $67,943 | $25,611 | $42,332 |
| 2012 | $6,315 | $68,079 | $25,662 | $42,417 |
Source: Public Records
Map
Nearby Homes
- 390 Springside Ln
- 746 Old Checker Rd Unit E5
- 610 Checker Dr
- 1112 Auburn Ln
- 412 Chateau Dr
- 800 Clohesey Dr
- 711 Woodhollow Ln
- 98 Stonegate Rd
- 931 Shady Grove Ln
- 950 Belmar Ln
- 12 Cloverdale Ct
- 603 Cherbourg Ct N
- 1141 Devonshire Rd
- 887 Saybrook Ln Unit 2
- 625 Marseilles Cir
- 670 Dunhill Dr
- 315 Cherrywood Rd
- 720 Dunhill Dr
- 938 Hidden Lake Dr
- 1514 Sumter Dr
- 380 Checker Dr
- 400 Checker Dr
- 381 Springside Ln
- 391 Springside Ln
- 371 Springside Ln Unit 5
- 370 Checker Dr
- 410 Checker Dr Unit 5
- 401 Springside Ln
- 361 Springside Ln
- 401 Checker Dr
- 391 Checker Dr
- 411 Checker Dr
- 360 Checker Dr
- 420 Checker Dr
- 421 Checker Dr
- 381 Checker Dr
- 411 Springside Ln
- 351 Springside Ln
- 10 Springside Ct
- 350 Checker Dr