Estimated Value: $479,000 - $591,000
3
Beds
2
Baths
1,680
Sq Ft
$306/Sq Ft
Est. Value
About This Home
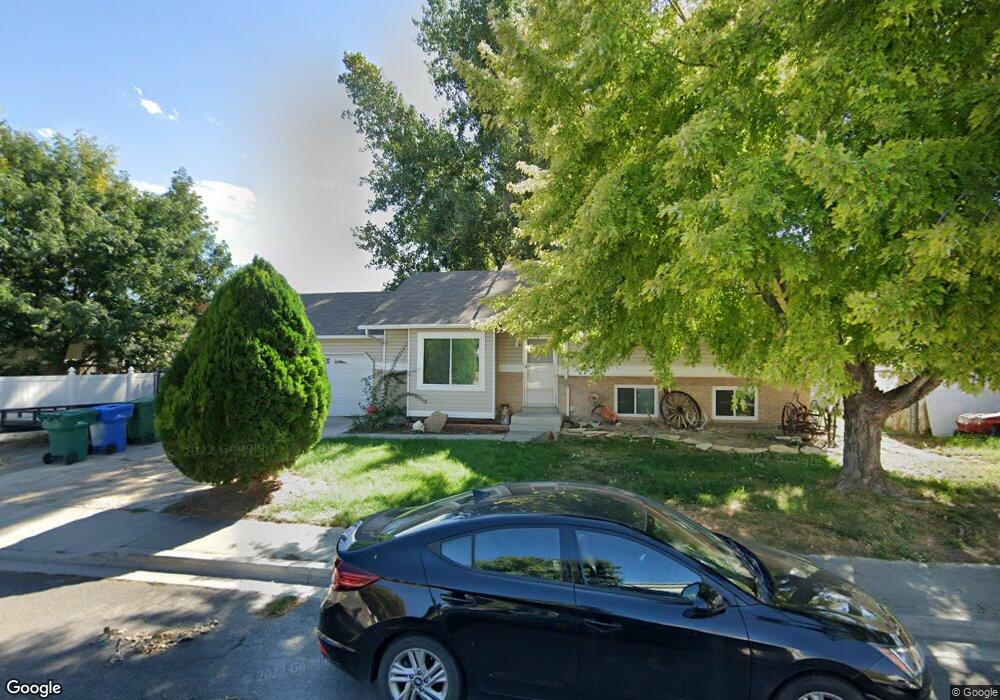
This home is located at 390 E 350 S, Lehi, UT 84043 and is currently estimated at $513,478, approximately $305 per square foot. 390 E 350 S is a home located in Utah County with nearby schools including Meadow Elementary School, Lehi Junior High School, and Lehi High School.
Ownership History
Date
Name
Owned For
Owner Type
Purchase Details
Closed on
Dec 17, 2020
Sold by
Burnham Tony F
Bought by
Burnham Tony F and The Tony F Burnham Trust
Current Estimated Value
Purchase Details
Closed on
Jun 29, 2009
Sold by
Burnham Grant K and Burnham Donna Taylor
Bought by
Burnham Tony F
Home Financials for this Owner
Home Financials are based on the most recent Mortgage that was taken out on this home.
Original Mortgage
$13,195
Interest Rate
4.87%
Mortgage Type
Stand Alone Second
Purchase Details
Closed on
May 13, 1998
Sold by
Burnham Grant K and Burnham Donna Taylor
Bought by
Burnham Partners
Home Financials for this Owner
Home Financials are based on the most recent Mortgage that was taken out on this home.
Original Mortgage
$88,900
Interest Rate
7.13%
Create a Home Valuation Report for This Property
The Home Valuation Report is an in-depth analysis detailing your home's value as well as a comparison with similar homes in the area
Home Values in the Area
Average Home Value in this Area
Purchase History
| Date | Buyer | Sale Price | Title Company |
|---|---|---|---|
| Burnham Tony F | -- | None Available | |
| Burnham Tony F | -- | None Available | |
| Burnham Partners | -- | -- | |
| Burnham Grant K | -- | -- |
Source: Public Records
Mortgage History
| Date | Status | Borrower | Loan Amount |
|---|---|---|---|
| Closed | Burnham Tony F | $13,195 | |
| Open | Burnham Tony F | $91,572 | |
| Closed | Burnham Grant K | $88,900 |
Source: Public Records
Tax History
| Year | Tax Paid | Tax Assessment Tax Assessment Total Assessment is a certain percentage of the fair market value that is determined by local assessors to be the total taxable value of land and additions on the property. | Land | Improvement |
|---|---|---|---|---|
| 2025 | $1,855 | $240,680 | -- | -- |
| 2024 | $1,855 | $217,085 | $0 | $0 |
| 2023 | $1,708 | $216,975 | $0 | $0 |
| 2022 | $1,815 | $223,575 | $0 | $0 |
| 2021 | $1,609 | $299,600 | $104,200 | $195,400 |
| 2020 | $1,516 | $279,100 | $96,500 | $182,600 |
| 2019 | $1,334 | $255,300 | $96,500 | $158,800 |
| 2018 | $1,297 | $234,600 | $96,500 | $138,100 |
| 2017 | $1,204 | $115,775 | $0 | $0 |
| 2016 | $1,194 | $106,590 | $0 | $0 |
| 2015 | $1,201 | $101,750 | $0 | $0 |
| 2014 | $1,074 | $90,475 | $0 | $0 |
Source: Public Records
Map
Nearby Homes
Your Personal Tour Guide
Ask me questions while you tour the home.