Estimated Value: $275,280 - $290,000
3
Beds
1
Bath
800
Sq Ft
$353/Sq Ft
Est. Value
About This Home
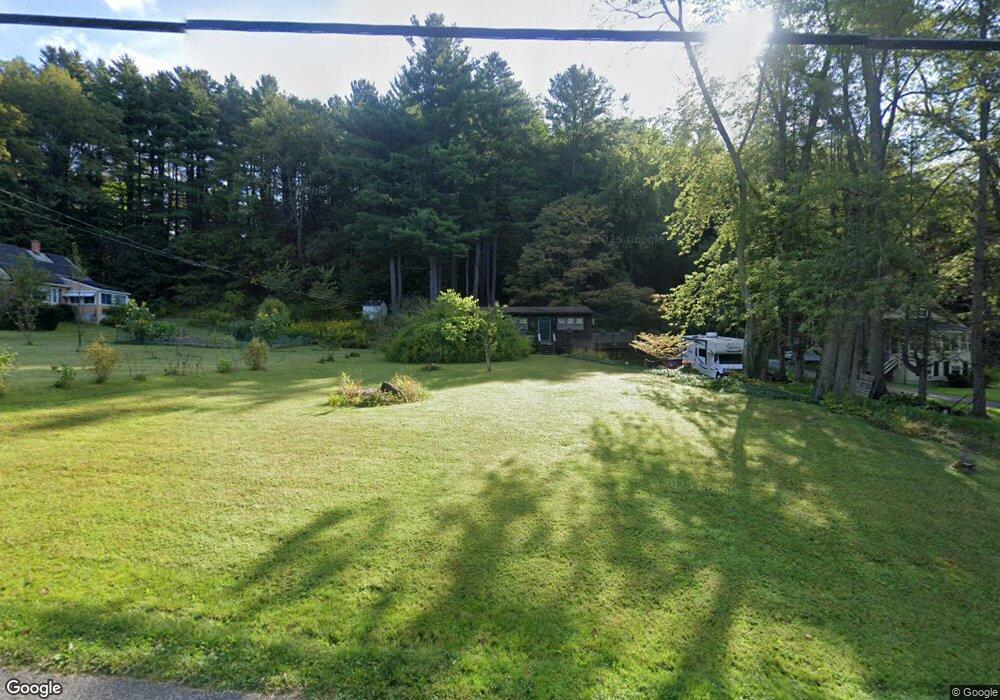
This home is located at 390 Greylock St, Lee, MA 01238 and is currently estimated at $282,320, approximately $352 per square foot. 390 Greylock St is a home located in Berkshire County with nearby schools including Lee Elementary School, Lee Middle/High School, and St. Mary's School.
Ownership History
Date
Name
Owned For
Owner Type
Purchase Details
Closed on
Mar 24, 2000
Sold by
Deely Ann D and Sterns Nina V
Bought by
Abbott Jacqueline and Walsh Maryellen
Current Estimated Value
Home Financials for this Owner
Home Financials are based on the most recent Mortgage that was taken out on this home.
Original Mortgage
$68,000
Outstanding Balance
$23,079
Interest Rate
8.31%
Mortgage Type
Purchase Money Mortgage
Estimated Equity
$259,241
Create a Home Valuation Report for This Property
The Home Valuation Report is an in-depth analysis detailing your home's value as well as a comparison with similar homes in the area
Home Values in the Area
Average Home Value in this Area
Purchase History
| Date | Buyer | Sale Price | Title Company |
|---|---|---|---|
| Abbott Jacqueline | $53,153 | -- |
Source: Public Records
Mortgage History
| Date | Status | Borrower | Loan Amount |
|---|---|---|---|
| Open | Abbott Jacqueline | $68,000 |
Source: Public Records
Tax History
| Year | Tax Paid | Tax Assessment Tax Assessment Total Assessment is a certain percentage of the fair market value that is determined by local assessors to be the total taxable value of land and additions on the property. | Land | Improvement |
|---|---|---|---|---|
| 2025 | $2,786 | $247,600 | $112,600 | $135,000 |
| 2024 | $2,708 | $240,900 | $107,100 | $133,800 |
| 2023 | $2,618 | $221,300 | $102,900 | $118,400 |
| 2022 | $2,484 | $182,000 | $97,200 | $84,800 |
| 2021 | $2,380 | $162,100 | $87,100 | $75,000 |
| 2020 | $2,286 | $155,700 | $81,500 | $74,200 |
| 2019 | $2,331 | $157,700 | $83,500 | $74,200 |
| 2018 | $2,307 | $157,700 | $83,500 | $74,200 |
| 2017 | $2,251 | $152,900 | $71,300 | $81,600 |
| 2016 | $2,130 | $146,300 | $69,300 | $77,000 |
| 2015 | $2,060 | $146,300 | $69,300 | $77,000 |
| 2014 | $2,006 | $141,800 | $69,300 | $72,500 |
Source: Public Records
Map
Nearby Homes
- 290 E Center St
- 0 East St Unit 235893
- 135 East St
- 180 Center St
- 205 High St
- 131 Center St
- 155 Water St Unit 5
- 155 Laurel St
- 45 Forest St
- 140 Theresa Terrace
- 2 Devon Rd
- 735 Cape St
- 184 Washington Mountain Rd
- 800 Cape St
- 615 Laurel St
- 528 Walker St
- 524 Walker St
- 500 Walker St
- 20 Forest St
- 2 Saint Andrews Ct
- 380 Greylock St
- 410 Greylock St
- 407 Greylock St
- 420 Greylock St
- 422 Greylock St
- 360 Greylock St
- 401 Greylock St
- 387 Greylock St
- 421 Greylock St
- 375 Greylock St
- 365 Greylock St
- 350 Greylock St
- 435 Greylock St
- 440 Greylock St
- 345 Greylock St
- 450 Greylock St
- 431 Greylock St
- 455 Greylock St
- 335 Greylock St
- 0 Greylock St
Your Personal Tour Guide
Ask me questions while you tour the home.