390 Liberty Hill Loop Ethridge, TN 38456
Estimated Value: $511,011 - $528,000
--
Bed
3
Baths
1,728
Sq Ft
$300/Sq Ft
Est. Value
About This Home
This home is located at 390 Liberty Hill Loop, Ethridge, TN 38456 and is currently estimated at $517,670, approximately $299 per square foot. 390 Liberty Hill Loop is a home located in Giles County with nearby schools including Richland Elementary School and Richland School.
Ownership History
Date
Name
Owned For
Owner Type
Purchase Details
Closed on
Oct 21, 1997
Sold by
Faulkner Herbert and Faulkner Evelyn
Bought by
Hostetler Levi and Hostetler Lydia
Current Estimated Value
Home Financials for this Owner
Home Financials are based on the most recent Mortgage that was taken out on this home.
Original Mortgage
$20,000
Interest Rate
7.39%
Purchase Details
Closed on
Oct 7, 1996
Sold by
Inman Charles and Inman Tracy
Bought by
Faulkner Herbert and Faulkner Evelyn
Purchase Details
Closed on
Jul 22, 1996
Sold by
Shirey Ronald W
Bought by
Inman Charles and Inman Tracy
Purchase Details
Closed on
Apr 8, 1993
Bought by
Shirey Ronald W and Shirey Sue M
Purchase Details
Closed on
Mar 22, 1990
Bought by
Dunavant Mark H and Dunavant Louise C
Purchase Details
Closed on
Mar 3, 1981
Bought by
Dunavant E M
Purchase Details
Closed on
Mar 29, 1972
Create a Home Valuation Report for This Property
The Home Valuation Report is an in-depth analysis detailing your home's value as well as a comparison with similar homes in the area
Home Values in the Area
Average Home Value in this Area
Purchase History
| Date | Buyer | Sale Price | Title Company |
|---|---|---|---|
| Hostetler Levi | $22,500 | -- | |
| Faulkner Herbert | $18,000 | -- | |
| Inman Charles | $37,000 | -- | |
| Shirey Ronald W | $26,900 | -- | |
| Dunavant Mark H | -- | -- | |
| Dunavant E M | -- | -- | |
| -- | -- | -- |
Source: Public Records
Mortgage History
| Date | Status | Borrower | Loan Amount |
|---|---|---|---|
| Closed | Not Available | $20,000 |
Source: Public Records
Tax History Compared to Growth
Tax History
| Year | Tax Paid | Tax Assessment Tax Assessment Total Assessment is a certain percentage of the fair market value that is determined by local assessors to be the total taxable value of land and additions on the property. | Land | Improvement |
|---|---|---|---|---|
| 2024 | $1,510 | $76,025 | $13,525 | $62,500 |
| 2023 | $1,510 | $76,025 | $13,525 | $62,500 |
| 2022 | $1,510 | $76,025 | $13,525 | $62,500 |
| 2021 | $1,708 | $60,475 | $11,050 | $49,425 |
| 2020 | $1,708 | $60,475 | $11,050 | $49,425 |
| 2019 | $1,708 | $60,475 | $11,050 | $49,425 |
| 2018 | $1,708 | $60,475 | $11,050 | $49,425 |
| 2017 | $1,587 | $56,200 | $11,050 | $45,150 |
| 2016 | $1,446 | $48,675 | $8,725 | $39,950 |
| 2015 | $1,349 | $48,675 | $8,725 | $39,950 |
| 2014 | $1,349 | $48,681 | $0 | $0 |
Source: Public Records
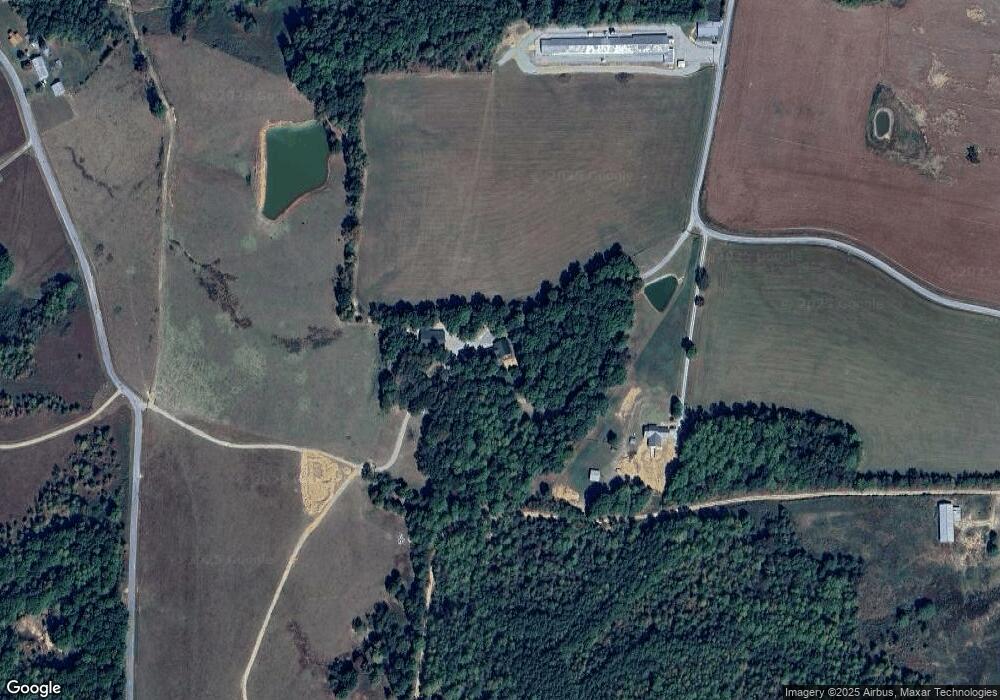
Map
Nearby Homes
- 3812 Rhea Branch Rd
- 492 Campbellsville Pike
- 1344 Cut Off Rd
- 2270 Schuler Branch Rd
- 2338 Rhea Branch Rd
- 2310 Rhea Branch Rd
- 2270 Shuler Branch Rd
- 2346 Rhea Branch Rd
- 205 Dooley Rd
- 0 Weakley Loop
- 0 Valor Reserve Ln Unit RTC2992363
- 67 James Rd
- 0 Weakley Loop Rd
- 202 Weakley Loop
- 187 Campbellsville Pike
- 0 Rushing Rd
- 0 Powdermill Bridge Rd
- 5 Carol Rd
- 0 Dugout Rd
- 135 Campbellsville Pike
- 250 Liberty Hill Loop
- 826 Liberty Hill Loop
- 4795 Rhea Branch Rd
- 338 Coy Risner Rd
- 431 Sugarland Rd
- 951 Sugarland Rd
- 0 Sugarland Rd
- 159 Liberty Hill Loop
- 801 Liberty Hill Loop
- 4783 Rhea Branch Rd
- 350 Sugarland Rd
- 20 Fieldstone Rd
- 4635 Rhea Branch Rd
- 4977 Rhea Branch Rd
- 4489 Rhea Branch Rd
- 360 Sugarland Rd
- 4405 Rhea Branch Rd
- 4858 Rhea Branch Rd
- 4750 Rhea Branch Rd
- 5000 Rhea Branch Rd