Estimated Value: $431,000 - $479,000
4
Beds
1
Bath
1,200
Sq Ft
$383/Sq Ft
Est. Value
About This Home
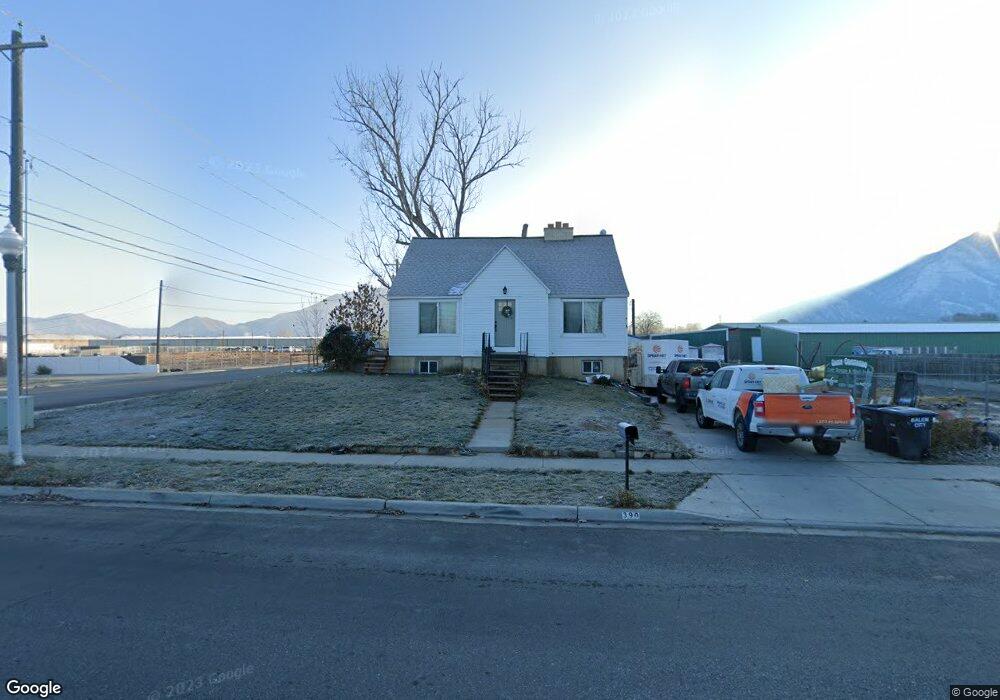
This home is located at 390 N Main St, Salem, UT 84653 and is currently estimated at $459,537, approximately $382 per square foot. 390 N Main St is a home located in Utah County with nearby schools including Salem Elementary, Salem Junior High School, and Valley View Middle School.
Ownership History
Date
Name
Owned For
Owner Type
Purchase Details
Closed on
Feb 13, 2023
Sold by
Snelgrove Brad
Bought by
Snelgrove Heidi and Snelgrove Brad
Current Estimated Value
Home Financials for this Owner
Home Financials are based on the most recent Mortgage that was taken out on this home.
Original Mortgage
$277,200
Outstanding Balance
$268,735
Interest Rate
6.48%
Mortgage Type
New Conventional
Estimated Equity
$190,802
Purchase Details
Closed on
Jun 2, 2021
Sold by
Critchfield Ross A and Critchfield Berneil
Bought by
Snelgrove Brad and Snelgrove Heidi
Purchase Details
Closed on
Jan 20, 2019
Sold by
Critchfield Ross A and Critchfield Berneil
Bought by
Critchfield Ross A and Critchfield Berniel
Purchase Details
Closed on
Jan 29, 2009
Sold by
Dal Group Of Utah Llc
Bought by
Storage Connection Of Utah Llc
Create a Home Valuation Report for This Property
The Home Valuation Report is an in-depth analysis detailing your home's value as well as a comparison with similar homes in the area
Home Values in the Area
Average Home Value in this Area
Purchase History
| Date | Buyer | Sale Price | Title Company |
|---|---|---|---|
| Snelgrove Heidi | -- | Greenbrier Title | |
| Snelgrove Brad | -- | First American Title | |
| Critchfield Ross A | -- | None Available | |
| Storage Connection Of Utah Llc | -- | None Available |
Source: Public Records
Mortgage History
| Date | Status | Borrower | Loan Amount |
|---|---|---|---|
| Open | Snelgrove Heidi | $277,200 |
Source: Public Records
Tax History Compared to Growth
Tax History
| Year | Tax Paid | Tax Assessment Tax Assessment Total Assessment is a certain percentage of the fair market value that is determined by local assessors to be the total taxable value of land and additions on the property. | Land | Improvement |
|---|---|---|---|---|
| 2025 | $1,944 | $227,370 | $169,800 | $243,600 |
| 2024 | $1,944 | $197,175 | $0 | $0 |
| 2023 | $1,916 | $194,700 | $0 | $0 |
| 2022 | $1,841 | $184,195 | $0 | $0 |
| 2021 | $1,464 | $234,900 | $98,500 | $136,400 |
| 2020 | $1,397 | $218,200 | $89,500 | $128,700 |
| 2019 | $1,238 | $197,500 | $85,600 | $111,900 |
| 2018 | $1,149 | $175,100 | $77,800 | $97,300 |
| 2017 | $1,122 | $91,190 | $0 | $0 |
| 2016 | $1,005 | $80,795 | $0 | $0 |
| 2015 | $920 | $72,600 | $0 | $0 |
| 2014 | $891 | $70,400 | $0 | $0 |
Source: Public Records
Map
Nearby Homes
- 191 E 560 N
- 432 E 300 N Unit 12
- 685-1197 N 1850 E
- 689-1198 N 1850 E
- 16 W 650 N Unit 1
- 52 W 650 N Unit 3
- 128 W 650 N
- 146 W 650 N
- 1223 N 360 E Unit 129
- 1212 N 360 E Unit 132
- 1195 N 360 E Unit 127
- 1241 N 360 E Unit 130
- 1238 N 360 E Unit 133
- 1207 N 360 E Unit 128
- 1165 N 360 E Unit 75
- 172 W 650 N
- 205 E Center St
- 703 N 150 E
- 685 N 220 E
- 708 N 220 E