390 River Rd Deerfield, MA 01342
Estimated Value: $475,922 - $551,000
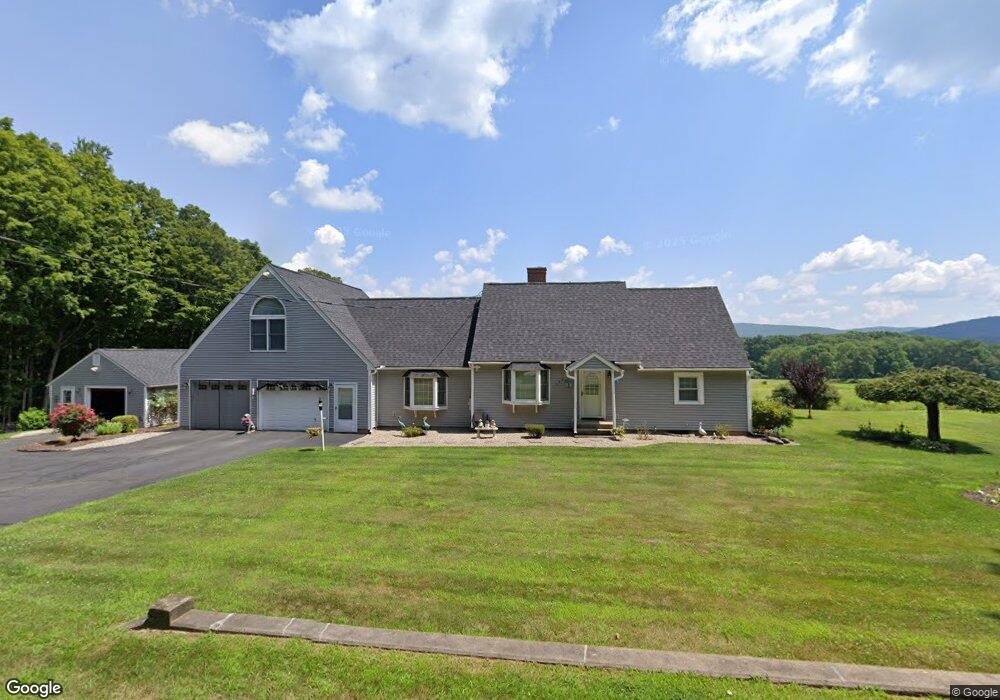
About This Home
This home is located at 390 River Rd, Deerfield, MA 01342 and is currently estimated at $506,481, approximately $230 per square foot. 390 River Rd is a home located in Franklin County with nearby schools including Deerfield Elementary School, Frontier Regional School, and Eaglebrook School.
Ownership History
We collect this data history from publicly available records. To have your information removed, we recommend requesting removal directly through your county’s website.
Purchase Details
Home Financials for this Owner
Home Financials are based on the most recent Mortgage that was taken out on this home.Home Values in the Area
Average Home Value in this Area
Purchase History
We collect this data history from publicly available records. To have your information removed, we recommend requesting removal directly through your county’s website.
| Date | Buyer | Sale Price | Title Company |
|---|---|---|---|
| $60,000 | -- |
Mortgage History
We collect this data history from publicly available records. To have your information removed, we recommend requesting removal directly through your county’s website.
| Date | Status | Borrower | Loan Amount |
|---|---|---|---|
| Closed | $145,000 | ||
| Closed | $50,000 | ||
| Closed | $144,000 | ||
| Closed | $43,000 | ||
| Closed | $42,000 | ||
| Closed | $25,000 | ||
| Closed | $110,000 | ||
| Closed | $90,000 | ||
| Closed | $31,000 | ||
| Closed | $10,000 |
Tax History
We collect this data history from publicly available records. To have your information removed, we recommend requesting removal directly through your county’s website.
| Year | Tax Paid | Tax Assessment Tax Assessment Total Assessment is a certain percentage of the fair market value that is determined by local assessors to be the total taxable value of land and additions on the property. | Land | Improvement |
|---|---|---|---|---|
| 2025 | $5,397 | $407,300 | $131,400 | $275,900 |
| 2024 | $5,163 | $372,800 | $119,400 | $253,400 |
| 2023 | $4,849 | $323,900 | $93,600 | $230,300 |
| 2022 | $4,835 | $318,700 | $93,600 | $225,100 |
| 2021 | $4,709 | $297,100 | $93,600 | $203,500 |
| 2020 | $4,661 | $297,100 | $93,600 | $203,500 |
| 2019 | $4,463 | $280,500 | $93,600 | $186,900 |
| 2018 | $4,311 | $270,300 | $89,600 | $180,700 |
| 2017 | $4,164 | $270,400 | $89,600 | $180,800 |
| 2016 | $4,040 | $264,900 | $85,600 | $179,300 |
| 2015 | $3,958 | $264,900 | $85,600 | $179,300 |
Map
- 477 River Rd
- 0 Pocumtuck Dr Unit 73379330
- 435 Montague Rd
- 470 Montague Rd
- 392 Greenfield Rd
- 17 Captain Lathrop Dr
- 136 N Main St
- 117 N Main St
- TBD Lower Rd
- 0 N Leverett Unit 73499764
- 6 Duncan Dr Unit B
- 271 Lower Rd
- 72 Stillwater Rd Unit A
- 9 Gray Lock Ln Unit B
- 54 Sawmill Plain Rd
- 89 Sugarloaf St
- 49 Sawmill Plain Rd
- 247 Montague Rd
- 43 Garage Rd
- 31 West St
Ask me questions while you tour the home.