Estimated Value: $1,831,000
8
Beds
8
Baths
4,064
Sq Ft
$451/Sq Ft
Est. Value
About This Home
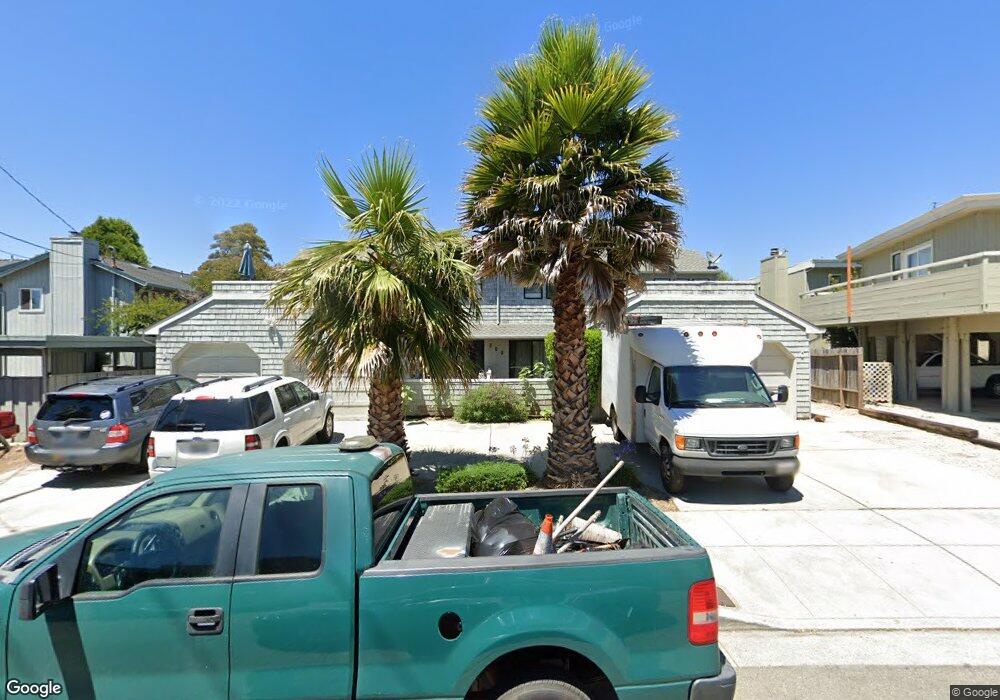
This home is located at 390 Sea Ridge Rd Unit A, Aptos, CA 95003 and is currently estimated at $1,831,000, approximately $450 per square foot. 390 Sea Ridge Rd Unit A is a home located in Santa Cruz County with nearby schools including Mar Vista Elementary School, Aptos Junior High School, and Aptos High School.
Ownership History
Date
Name
Owned For
Owner Type
Purchase Details
Closed on
Apr 10, 2024
Sold by
1985 Leite Living Trust and Leite Edward
Bought by
1985 Leite Family Trust and Leite
Current Estimated Value
Purchase Details
Closed on
Dec 1, 1995
Sold by
Packard Leite Jeanne
Bought by
Packard Leite Jeanne
Purchase Details
Closed on
Sep 5, 1995
Sold by
Searidge Associates and Leite Edward
Bought by
Packard Leite Jeanne
Home Financials for this Owner
Home Financials are based on the most recent Mortgage that was taken out on this home.
Original Mortgage
$75,000
Interest Rate
7.88%
Purchase Details
Closed on
Jun 23, 1992
Sold by
Feldner Fredric R and Feldner Virginia H
Bought by
Feldner Fredric R and Feldner Virginia H
Create a Home Valuation Report for This Property
The Home Valuation Report is an in-depth analysis detailing your home's value as well as a comparison with similar homes in the area
Home Values in the Area
Average Home Value in this Area
Purchase History
| Date | Buyer | Sale Price | Title Company |
|---|---|---|---|
| 1985 Leite Family Trust | -- | None Listed On Document | |
| Packard Leite Jeanne | -- | Santa Cruz Title Company | |
| Packard Leite Jeanne | $480,000 | Santa Cruz Title Company | |
| Feldner Fredric R | -- | -- |
Source: Public Records
Mortgage History
| Date | Status | Borrower | Loan Amount |
|---|---|---|---|
| Previous Owner | Packard Leite Jeanne | $75,000 |
Source: Public Records
Tax History
| Year | Tax Paid | Tax Assessment Tax Assessment Total Assessment is a certain percentage of the fair market value that is determined by local assessors to be the total taxable value of land and additions on the property. | Land | Improvement |
|---|---|---|---|---|
| 2025 | $12,787 | $797,424 | $299,032 | $498,392 |
| 2023 | $12,402 | $766,458 | $287,420 | $479,038 |
| 2022 | $12,049 | $751,430 | $281,784 | $469,646 |
| 2021 | $11,611 | $736,696 | $276,260 | $460,436 |
| 2020 | $11,368 | $729,142 | $273,426 | $455,716 |
| 2019 | $11,155 | $714,846 | $268,066 | $446,780 |
| 2018 | $10,813 | $700,830 | $262,810 | $438,020 |
| 2017 | $10,667 | $687,088 | $257,656 | $429,432 |
| 2016 | $7,849 | $673,616 | $252,604 | $421,012 |
Source: Public Records
Map
Nearby Homes
- 423 Hillcrest Dr
- 522 Spruce St
- 836 Seacliff Dr
- 716 Seacliff Dr
- 49 Greco St Unit 49
- 2711 Mar Vista Dr Unit 15
- 2831 Casa de Vida Dr
- 254 Center Ave
- 2979 Mar Vista Dr Unit 102
- 797 Las Olas Dr
- 101 Aptos Village Way Unit 4
- 117 Marina Ave
- 111 Aptos Village Way Unit 2
- 111 Aptos Village Way Unit 1
- 307 Treasure Island Dr Unit 1
- 118 Marina Ave
- 347 Treasure Island Dr
- 131 Aptos Village Way Unit 2
- 130 Hainline Rd
- 126 Aptos Village Way Unit 2
- 396 Sea Ridge Rd Unit 1
- 380 Sea Ridge Rd
- 380 Sea Ridge Rd Unit A
- 380 Sea Ridge Rd Unit E
- 380 Sea Ridge Rd Unit D
- 380 Sea Ridge Rd Unit C
- 0 Mar Vista Dr
- 372 Sea Ridge Rd Unit 2
- 372 Sea Ridge Rd Unit 1
- 372 Sea Ridge Rd
- 372 Sea Ridge Rd Unit 4
- 372 Sea Ridge Rd Unit 5
- 399 Sea Ridge Rd Unit C
- 399 Sea Ridge Rd Unit B
- 501 Pine St
- 201 Mar Vista Dr
- 385 Sea Ridge Rd
- 503 Pine St
- 102 Lloyd Ct
- 504 Pine St Unit A
Your Personal Tour Guide
Ask me questions while you tour the home.