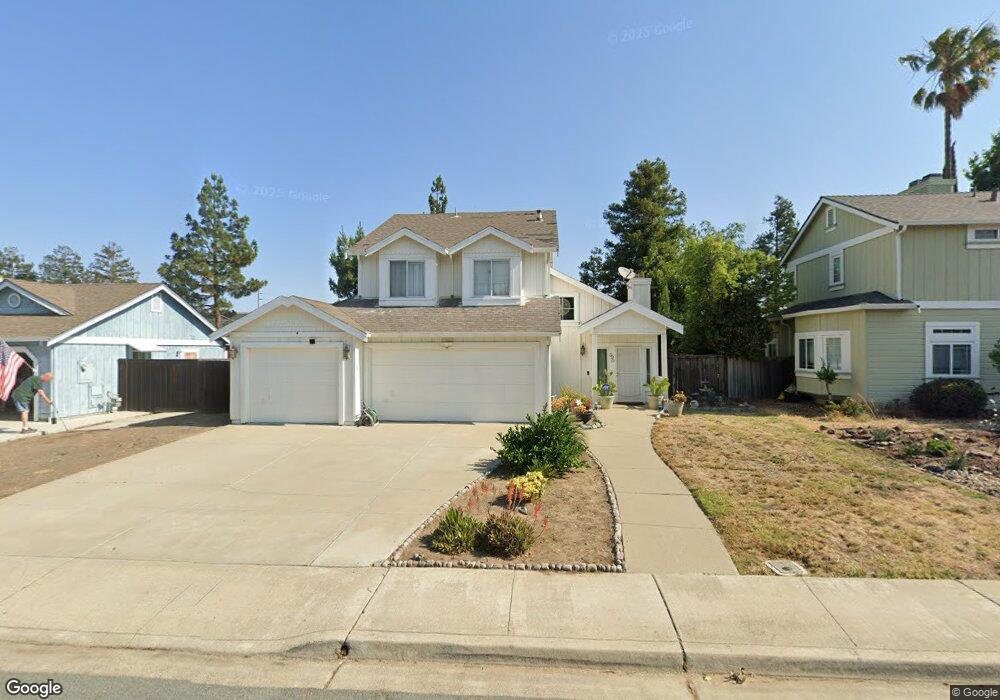
390 W Ruby St Oakley, CA 94561
Estimated Value: $490,000 - $578,000
3
Beds
3
Baths
1,461
Sq Ft
$372/Sq Ft
Est. Value
About This Home
This home is located at 390 W Ruby St, Oakley, CA 94561 and is currently estimated at $543,558, approximately $372 per square foot. 390 W Ruby St is a home located in Contra Costa County with nearby schools including Oakley Elementary School, O'Hara Park Middle School, and Freedom High School.
Ownership History
Date
Name
Owned For
Owner Type
Purchase Details
Closed on
Dec 15, 2017
Sold by
Cooper Kennard W
Bought by
Agpalasin Bette Tipay
Current Estimated Value
Home Financials for this Owner
Home Financials are based on the most recent Mortgage that was taken out on this home.
Original Mortgage
$386,650
Outstanding Balance
$325,188
Interest Rate
3.9%
Mortgage Type
FHA
Estimated Equity
$218,370
Create a Home Valuation Report for This Property
The Home Valuation Report is an in-depth analysis detailing your home's value as well as a comparison with similar homes in the area
Home Values in the Area
Average Home Value in this Area
Purchase History
| Date | Buyer | Sale Price | Title Company |
|---|---|---|---|
| Agpalasin Bette Tipay | $400,000 | Fidelity National Title Co |
Source: Public Records
Mortgage History
| Date | Status | Borrower | Loan Amount |
|---|---|---|---|
| Open | Agpalasin Bette Tipay | $386,650 |
Source: Public Records
Tax History
| Year | Tax Paid | Tax Assessment Tax Assessment Total Assessment is a certain percentage of the fair market value that is determined by local assessors to be the total taxable value of land and additions on the property. | Land | Improvement |
|---|---|---|---|---|
| 2025 | $5,942 | $455,128 | $193,429 | $261,699 |
| 2024 | $5,769 | $446,205 | $189,637 | $256,568 |
| 2023 | $5,769 | $437,457 | $185,919 | $251,538 |
| 2022 | $5,721 | $428,880 | $182,274 | $246,606 |
| 2021 | $5,630 | $420,471 | $178,700 | $241,771 |
| 2019 | $5,359 | $408,000 | $173,400 | $234,600 |
| 2018 | $5,217 | $400,000 | $170,000 | $230,000 |
| 2017 | $3,100 | $203,279 | $59,807 | $143,472 |
| 2016 | $2,947 | $199,294 | $58,635 | $140,659 |
| 2015 | $3,049 | $196,302 | $57,755 | $138,547 |
| 2014 | $2,926 | $192,458 | $56,624 | $135,834 |
Source: Public Records
Map
Nearby Homes
- 201 Ohara Ave
- 1 Bradford Island Rd
- 4620 Duarte Ave
- 0 Main St Unit 41115212
- 1109 Deerpark Rd
- 4920 Dawson Dr
- 1104 Jordan Ln
- 1425 W Cypress Rd
- 4855 Edgewood Ct
- 912 Rhine Way
- 0 Almond Dr Unit 41106452
- 633 Country Ln
- 5025 Martin St
- 215 Spindrift Ct
- 1859 Santa fe St
- 1765 Delta Meadows Way
- 4834 Chablis Ct
- 641 Woodbury Place
- 7 Geneseo St
- 2019 Verona Ct
- 400 W Ruby St
- 380 W Ruby St
- 410 W Ruby St
- 370 W Ruby St
- 4800 Duarte Ave
- 405 W Ruby St
- 360 W Ruby St
- 4790 Duarte Ave
- 4795 Duarte Ave
- 350 W Ruby St
- 4780 Duarte Ave
- 4785 Duarte Ave
- 340 W Ruby St
- 4770 Duarte Ave
- 4960 Fuschia Way
- 4775 Duarte Ave
- 330 W Ruby St
- 4760 Duarte Ave
- 4765 Duarte Ave
- 320 W Ruby St
Your Personal Tour Guide
Ask me questions while you tour the home.