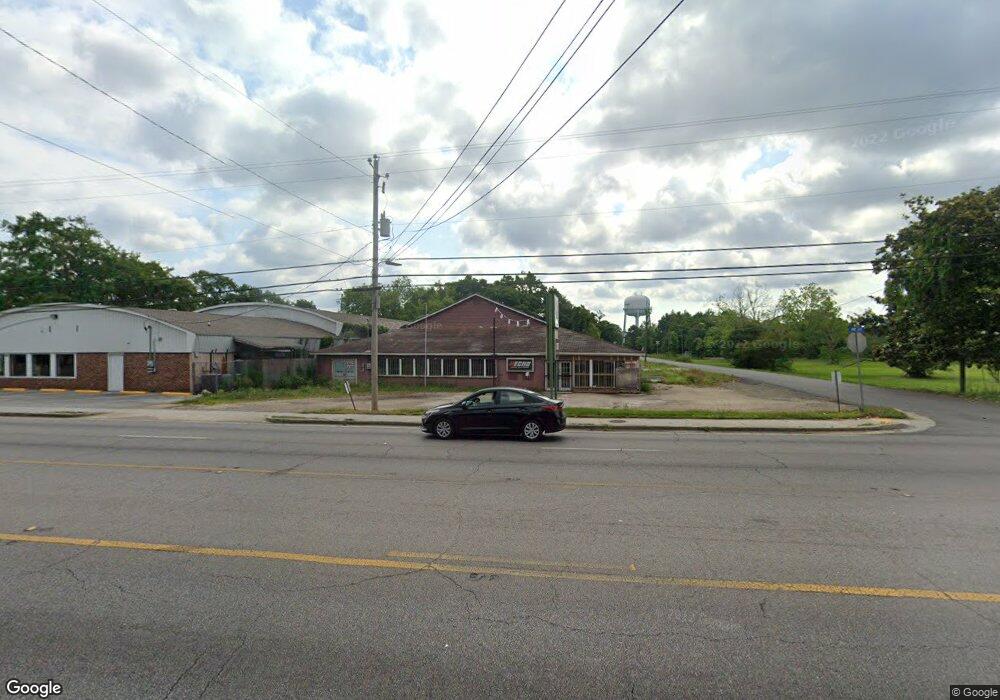
3900 Main St Moss Point, MS 39563
Estimated Value: $145,786
Studio
--
Bath
4,120
Sq Ft
$35/Sq Ft
Est. Value
About This Home
This home is located at 3900 Main St, Moss Point, MS 39563 and is currently priced at $145,786, approximately $35 per square foot. 3900 Main St is a home located in Jackson County with nearby schools including Kreole Primary Elementary School, Escatawpa Upper Elementary School, and Magnolia Middle School.
Ownership History
Date
Name
Owned For
Owner Type
Purchase Details
Closed on
Dec 30, 2025
Sold by
Bankfirst Financial Services
Bought by
1717 Van Buren Llc
Current Estimated Value
Purchase Details
Closed on
Mar 28, 2024
Sold by
Shoemaker Lillous Ann
Bought by
Magnolia State Bank
Purchase Details
Closed on
Jun 3, 2016
Sold by
Watts Enterprises Llc
Bought by
Underwood David
Home Financials for this Owner
Home Financials are based on the most recent Mortgage that was taken out on this home.
Original Mortgage
$250,000
Interest Rate
3.61%
Mortgage Type
Purchase Money Mortgage
Create a Home Valuation Report for This Property
The Home Valuation Report is an in-depth analysis detailing your home's value as well as a comparison with similar homes in the area
Home Values in the Area
Average Home Value in this Area
Purchase History
| Date | Buyer | Sale Price | Title Company |
|---|---|---|---|
| 1717 Van Buren Llc | -- | Island Winds Title | |
| Magnolia State Bank | -- | None Listed On Document | |
| Underwood David | -- | None Available |
Source: Public Records
Mortgage History
| Date | Status | Borrower | Loan Amount |
|---|---|---|---|
| Previous Owner | Underwood David | $250,000 |
Source: Public Records
Tax History
| Year | Tax Paid | Tax Assessment Tax Assessment Total Assessment is a certain percentage of the fair market value that is determined by local assessors to be the total taxable value of land and additions on the property. | Land | Improvement |
|---|---|---|---|---|
| 2025 | $3,396 | $19,778 | $6,111 | $13,667 |
| 2024 | $3,396 | $17,851 | $5,933 | $11,918 |
| 2023 | $3,065 | $17,851 | $5,933 | $11,918 |
| 2022 | $2,915 | $17,851 | $5,933 | $11,918 |
| 2021 | $2,916 | $17,851 | $5,933 | $11,918 |
| 2020 | $2,794 | $16,958 | $5,933 | $11,025 |
| 2019 | $2,787 | $16,958 | $5,933 | $11,025 |
| 2018 | $2,787 | $16,958 | $5,933 | $11,025 |
| 2017 | $2,698 | $16,478 | $5,933 | $10,545 |
| 2016 | $846 | $16,478 | $5,933 | $10,545 |
| 2015 | $798 | $103,510 | $39,550 | $63,960 |
| 2014 | $701 | $13,649 | $5,933 | $7,716 |
| 2013 | $701 | $13,649 | $5,933 | $7,716 |
Source: Public Records
Map
Nearby Homes
- Nhn Pearl Ave
- 4040 W Pine St
- 4042 Verlon St
- 4230 Martin Luther King Blvd
- 4301 Palmetto St
- 4718 Jackson Ave
- 3600 Mosby St
- 3906 River Pine Dr
- 4831 Community Ave
- 0 Magnolia St Unit 4111407
- 4401 Bowen St
- 4837 Diamond Ave
- 0 Baywood Dr Unit 4138232
- 4501 Payne St
- 3954 River Pine Dr
- 4643 Elder St
- 4745 Adams Ave
- 4747 Adams Ave
- 5031 Community Ave
- 0 Main St Unit 4090353
- 3907 Main St
- 3905 Main St
- 3831 Main St
- 3913 Main St
- 0 Main Point
- 3820 Main St
- 3818 Main St
- 4300 Pearl Ave
- 4307 Joseph Ave
- 4425 Community Ave
- 4425 Community Ave
- 4301 Joseph Ave
- 3806 Main St
- 4248 Pearl Ave
- 4219 Joseph Ave
- 4437 Community Ave
- 4436 Community Ave
- 4406 Payton St
- 3930 Joseph Ave
- 4213 Joseph Ave
Your Personal Tour Guide
Ask me questions while you tour the home.