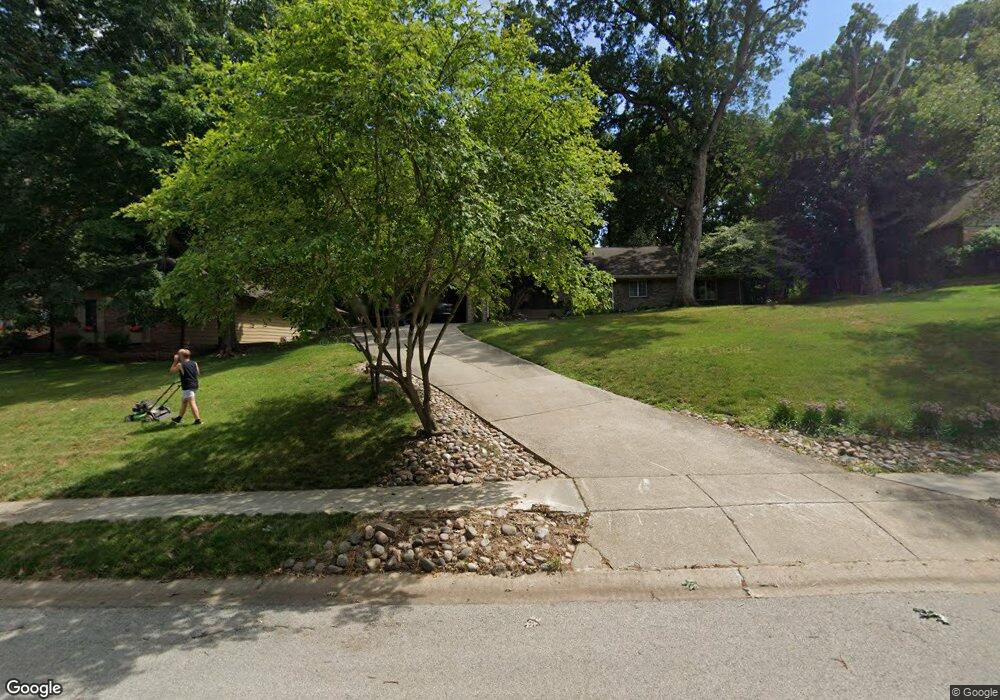
3900 West Bluffs Rd Springfield, IL 62711
Estimated Value: $362,000 - $392,961
--
Bed
--
Bath
--
Sq Ft
0.51
Acres
About This Home
This home is located at 3900 West Bluffs Rd, Springfield, IL 62711 and is currently estimated at $378,240. 3900 West Bluffs Rd is a home located in Sangamon County with nearby schools including Farmingdale Elementary School, Pleasant Plains Middle School, and Pleasant Plains High School.
Ownership History
Date
Name
Owned For
Owner Type
Purchase Details
Closed on
Apr 9, 2024
Sold by
West Tara
Bought by
Schindler Jill R and Lucas Darren L
Current Estimated Value
Home Financials for this Owner
Home Financials are based on the most recent Mortgage that was taken out on this home.
Original Mortgage
$289,200
Outstanding Balance
$285,080
Interest Rate
7.13%
Mortgage Type
New Conventional
Estimated Equity
$93,160
Purchase Details
Closed on
Dec 1, 2022
Sold by
Fallone Todd
Bought by
West Tara
Home Financials for this Owner
Home Financials are based on the most recent Mortgage that was taken out on this home.
Original Mortgage
$280,250
Interest Rate
6.95%
Mortgage Type
New Conventional
Purchase Details
Closed on
Jun 30, 2022
Sold by
Andrews E Jane
Bought by
Fallone Todd
Home Financials for this Owner
Home Financials are based on the most recent Mortgage that was taken out on this home.
Original Mortgage
$260,000
Interest Rate
5.1%
Mortgage Type
Credit Line Revolving
Purchase Details
Closed on
May 4, 2012
Create a Home Valuation Report for This Property
The Home Valuation Report is an in-depth analysis detailing your home's value as well as a comparison with similar homes in the area
Home Values in the Area
Average Home Value in this Area
Purchase History
| Date | Buyer | Sale Price | Title Company |
|---|---|---|---|
| Schindler Jill R | $362,000 | None Listed On Document | |
| West Tara | $295,000 | -- | |
| Fallone Todd | $243,000 | None Listed On Document | |
| -- | -- | -- |
Source: Public Records
Mortgage History
| Date | Status | Borrower | Loan Amount |
|---|---|---|---|
| Open | Schindler Jill R | $289,200 | |
| Previous Owner | West Tara | $280,250 | |
| Previous Owner | Fallone Todd | $260,000 |
Source: Public Records
Tax History Compared to Growth
Tax History
| Year | Tax Paid | Tax Assessment Tax Assessment Total Assessment is a certain percentage of the fair market value that is determined by local assessors to be the total taxable value of land and additions on the property. | Land | Improvement |
|---|---|---|---|---|
| 2024 | $9,298 | $127,664 | $14,797 | $112,867 |
| 2023 | $7,261 | $96,951 | $13,516 | $83,435 |
| 2022 | $8,115 | $109,982 | $12,819 | $97,163 |
| 2021 | $7,851 | $105,864 | $12,339 | $93,525 |
| 2020 | $7,890 | $106,023 | $12,358 | $93,665 |
| 2019 | $7,818 | $105,653 | $12,315 | $93,338 |
| 2018 | $7,686 | $105,138 | $12,255 | $92,883 |
| 2017 | $7,537 | $103,779 | $12,097 | $91,682 |
| 2016 | $7,456 | $102,266 | $11,921 | $90,345 |
| 2015 | $7,451 | $101,043 | $11,778 | $89,265 |
| 2014 | $7,392 | $100,391 | $11,702 | $88,689 |
| 2013 | $7,344 | $100,391 | $11,702 | $88,689 |
Source: Public Records
Map
Nearby Homes
- 3705 W Bluffs Rd
- 6 Pine Ridge Dr
- 2929 Cider Mill Ln
- 2905 Cider Mill Ln
- 624 Poinsettia Place
- 801 Coventry Point
- 2924 Flowerbrook Ct
- 4671 Casey Dr
- 4661 Casey Dr
- 238 Maggie Dr
- 3008 W Lawrence Ave
- 409 N Durkin Dr
- 609 Rock River Rd
- 604 Rock River Rd
- 9 Whisperglen Ln Unit 66
- 613 Rock River Rd
- 608 Rock River Rd
- 4319 Creek Dr
- 612 Rock River Rd
- 51 Mesa Rd
- 3900 W Bluffs Rd
- 3828 West Bluffs Rd
- 3828 W Bluffs Rd
- 3904 West Bluffs Rd
- 3824 West Bluffs Rd
- 3824 W Bluffs Rd
- 3905 West Bluffs Rd
- 3901 West Bluffs Rd
- 3908 West Bluffs Rd
- 13 Whippoorwill Rd Unit 1
- 9 Whippoorwill Rd Unit 1
- 3909 West Bluffs Rd
- 3825 West Bluffs Rd
- 3820 West Bluffs Rd
- 3912 West Bluffs Rd
- 3912 W Bluffs Rd
- 17 Whippoorwill Rd Unit 1
- 3821 West Bluffs Rd
- 5 Whippoorwill Rd Unit 1
- 3913 West Bluffs Rd