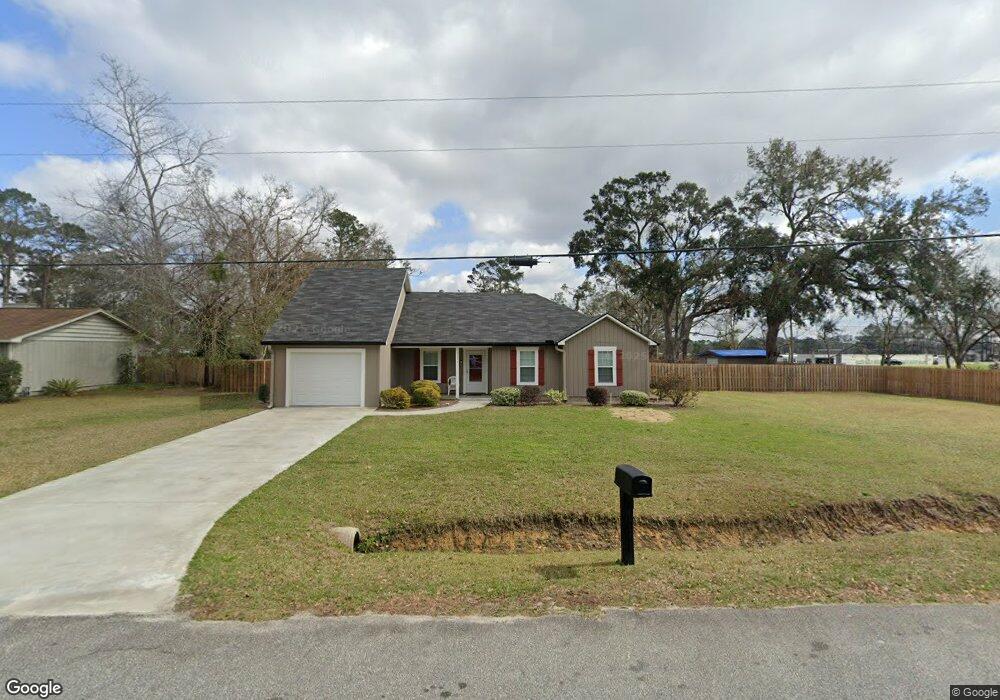
3901 Danube Cir Valdosta, GA 31605
Estimated Value: $167,000 - $216,000
3
Beds
2
Baths
1,230
Sq Ft
$161/Sq Ft
Est. Value
About This Home
This home is located at 3901 Danube Cir, Valdosta, GA 31605 and is currently estimated at $198,354, approximately $161 per square foot. 3901 Danube Cir is a home located in Lowndes County with nearby schools including Dewar Elementary School, Pine Grove Middle School, and Lowndes High School.
Ownership History
Date
Name
Owned For
Owner Type
Purchase Details
Closed on
Mar 12, 2020
Sold by
Zimmerman James S
Bought by
Ball Valorie M
Current Estimated Value
Home Financials for this Owner
Home Financials are based on the most recent Mortgage that was taken out on this home.
Original Mortgage
$105,120
Outstanding Balance
$93,099
Interest Rate
3.5%
Mortgage Type
New Conventional
Estimated Equity
$105,255
Purchase Details
Closed on
Dec 19, 2019
Sold by
Mollory Alysia L
Bought by
Zimmerman James S and Quinn Steve
Home Financials for this Owner
Home Financials are based on the most recent Mortgage that was taken out on this home.
Original Mortgage
$107,614
Interest Rate
3.6%
Mortgage Type
New Conventional
Purchase Details
Closed on
Oct 3, 1997
Bought by
Mollory Alysia L
Purchase Details
Closed on
Nov 30, 1978
Bought by
Hart Charles A and Hart Karlet
Create a Home Valuation Report for This Property
The Home Valuation Report is an in-depth analysis detailing your home's value as well as a comparison with similar homes in the area
Home Values in the Area
Average Home Value in this Area
Purchase History
| Date | Buyer | Sale Price | Title Company |
|---|---|---|---|
| Ball Valorie M | $131,400 | -- | |
| Zimmerman James S | $17,000 | -- | |
| Mollory Alysia L | $72,000 | -- | |
| Hart Charles A | $39,000 | -- |
Source: Public Records
Mortgage History
| Date | Status | Borrower | Loan Amount |
|---|---|---|---|
| Open | Ball Valorie M | $105,120 | |
| Previous Owner | Zimmerman James S | $107,614 |
Source: Public Records
Tax History Compared to Growth
Tax History
| Year | Tax Paid | Tax Assessment Tax Assessment Total Assessment is a certain percentage of the fair market value that is determined by local assessors to be the total taxable value of land and additions on the property. | Land | Improvement |
|---|---|---|---|---|
| 2024 | $1,199 | $60,280 | $10,000 | $50,280 |
| 2023 | $1,199 | $60,280 | $10,000 | $50,280 |
| 2022 | $1,128 | $40,452 | $10,000 | $30,452 |
| 2021 | $1,178 | $40,452 | $10,000 | $30,452 |
| 2020 | $184 | $10,800 | $10,000 | $800 |
| 2019 | $835 | $36,574 | $10,000 | $26,574 |
| 2018 | $844 | $36,574 | $10,000 | $26,574 |
| 2017 | $858 | $36,574 | $10,000 | $26,574 |
| 2016 | $937 | $39,310 | $10,000 | $29,310 |
| 2015 | $898 | $39,310 | $10,000 | $29,310 |
| 2014 | $917 | $39,310 | $10,000 | $29,310 |
Source: Public Records
Map
Nearby Homes
- 4004 Tack Trail
- 4010 Fritz Ln
- 3917 Pecan Dr
- 3903 Pecan Dr
- 309 Tomlinson Dr
- 3448 Bemiss Rd
- 3480 Bemiss Rd
- 310 Highland Heights Dr
- 2821 Clayton Dr
- 3120 Tyndall Dr
- 3122 Tyndall Dr
- 3200 Tyndall Dr Unit A/B
- 3202 Tyndall Dr Unit A/B
- 2719 2nd St N
- 3676 Tupelo Rd
- 4305 Brandonshire Ln
- 5026 Greyfield Place N
- 3703 Deidra Miller Cir
- 1903 Fawnridge Rd
- 7.63 AC Tyndall Dr
- 3903 Danube Cir
- 3900 Forrest Street Extension
- 3902 N Forrest St
- 3902 Forrest Street Extension
- 3900 Danube Cir
- 3905 Danube Cir
- 3902 Danube Cir
- 3904 Forrest Street Extension
- 3901 N Forrest
- 3506 Engberg Ave
- 3907 Danube Cir
- 3904 Danube Cir
- 4107 Martha Place
- 3906 Forrest Street Extension
- 3900 Cutter Point
- 3909 Danube Cir
- 3906 Danube Cir
- 4105 Martha Place
- 4109 Martha Place
- 3908 Forrest Street Extension