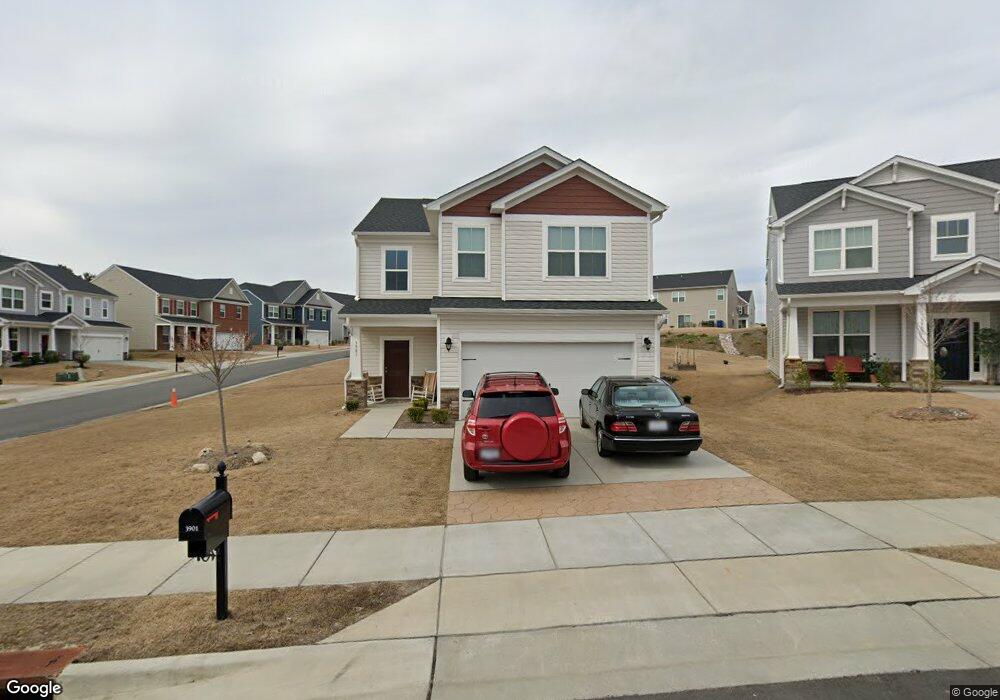
3901 Massey Pointe Ct Raleigh, NC 27616
Forestville NeighborhoodEstimated Value: $415,000 - $431,000
4
Beds
3
Baths
2,234
Sq Ft
$190/Sq Ft
Est. Value
About This Home
This home is located at 3901 Massey Pointe Ct, Raleigh, NC 27616 and is currently estimated at $423,813, approximately $189 per square foot. 3901 Massey Pointe Ct is a home located in Wake County with nearby schools including Harris Creek Elementary School, Rolesville Middle School, and Rolesville High School.
Ownership History
Date
Name
Owned For
Owner Type
Purchase Details
Closed on
Sep 5, 2024
Sold by
Sfr Javelin Borrower Lp and 2024-1 Ih Borrower Lp
Bought by
2024-1 Ih Borrower Lp
Current Estimated Value
Home Financials for this Owner
Home Financials are based on the most recent Mortgage that was taken out on this home.
Original Mortgage
$891,909,000
Outstanding Balance
$882,457,896
Interest Rate
6.78%
Mortgage Type
New Conventional
Estimated Equity
-$882,034,083
Purchase Details
Closed on
Jan 19, 2021
Sold by
Onyinkwa Lisper and Acholta Perminus O
Bought by
Sfr Javelin Borrower Lp
Purchase Details
Closed on
Sep 29, 2016
Sold by
Beazer Homes Corp
Bought by
Onyinkwa Lisper and Achoka Perminus O
Home Financials for this Owner
Home Financials are based on the most recent Mortgage that was taken out on this home.
Original Mortgage
$230,000
Interest Rate
4.25%
Mortgage Type
Adjustable Rate Mortgage/ARM
Create a Home Valuation Report for This Property
The Home Valuation Report is an in-depth analysis detailing your home's value as well as a comparison with similar homes in the area
Home Values in the Area
Average Home Value in this Area
Purchase History
| Date | Buyer | Sale Price | Title Company |
|---|---|---|---|
| 2024-1 Ih Borrower Lp | -- | Os National Title | |
| 2024-1 Ih Borrower Lp | -- | Os National Title | |
| Sfr Javelin Borrower Lp | $290,000 | Investors Title Insurance Co | |
| Onyinkwa Lisper | $230,500 | None Available |
Source: Public Records
Mortgage History
| Date | Status | Borrower | Loan Amount |
|---|---|---|---|
| Open | 2024-1 Ih Borrower Lp | $891,909,000 | |
| Closed | 2024-1 Ih Borrower Lp | $891,909,000 | |
| Previous Owner | Onyinkwa Lisper | $230,000 |
Source: Public Records
Tax History Compared to Growth
Tax History
| Year | Tax Paid | Tax Assessment Tax Assessment Total Assessment is a certain percentage of the fair market value that is determined by local assessors to be the total taxable value of land and additions on the property. | Land | Improvement |
|---|---|---|---|---|
| 2025 | $3,536 | $403,189 | $100,000 | $303,189 |
| 2024 | $3,522 | $403,189 | $100,000 | $303,189 |
| 2023 | $2,818 | $256,688 | $50,000 | $206,688 |
| 2022 | $2,619 | $256,688 | $50,000 | $206,688 |
| 2021 | $2,518 | $256,688 | $50,000 | $206,688 |
| 2020 | $2,472 | $256,688 | $50,000 | $206,688 |
| 2019 | $2,511 | $214,983 | $44,000 | $170,983 |
| 2018 | $2,369 | $214,983 | $44,000 | $170,983 |
| 2017 | $2,256 | $214,983 | $44,000 | $170,983 |
| 2016 | $448 | $44,000 | $44,000 | $0 |
Source: Public Records
Map
Nearby Homes
- 3925 Massey Pointe Ct
- 3519 Winding Walk Ct
- 3922 Massey Run
- 3709 Fan Palm Ct
- 4014 White Kestrel Dr
- 4009 Shadbush St
- 3742 Nicolyn Dr
- 3502 Massey Pond Trail
- 3451 Massey Pond Trail
- 4109 Massey Preserve Trail
- 3152 Landing Falls Ln
- 3242 Landing Falls Ln
- 4325 Laurel Pond Way
- 4306 Laurel Pond Way
- 4020 Wesley Chapel Way
- 4016 Wesley Chapel Way
- 3513 Telluride Trail
- 4036 Wesley Chapel Way
- 3521 Telluride Trail
- 4354 Laurel Pond Way
- 3905 Massey Pointe Ct
- 3544 Massey Ridge Ct
- 3909 Massey Pointe Ct
- 3537 Massey Ridge Ct
- 3524 Massey Ridge Ct
- 3533 Massey Ridge Ct Unit Lot 248
- 3533 Massey Run
- 3541 Massey Ridge Ct
- 3545 Massey Ridge Ct
- 3529 Massey Ridge Ct
- 3904 White Kestrel Dr
- 3908 White Kestrel Dr
- 3520 Massey Ridge Ct
- 3520 Massey Run
- 3900 White Kestrel Dr
- 3525 Massey Ridge Ct
- 3912 White Kestrel Dr
- 3549 Massey Ridge Ct
- 3916 Massey Pointe Ct
- 3916 White Kestrel Dr