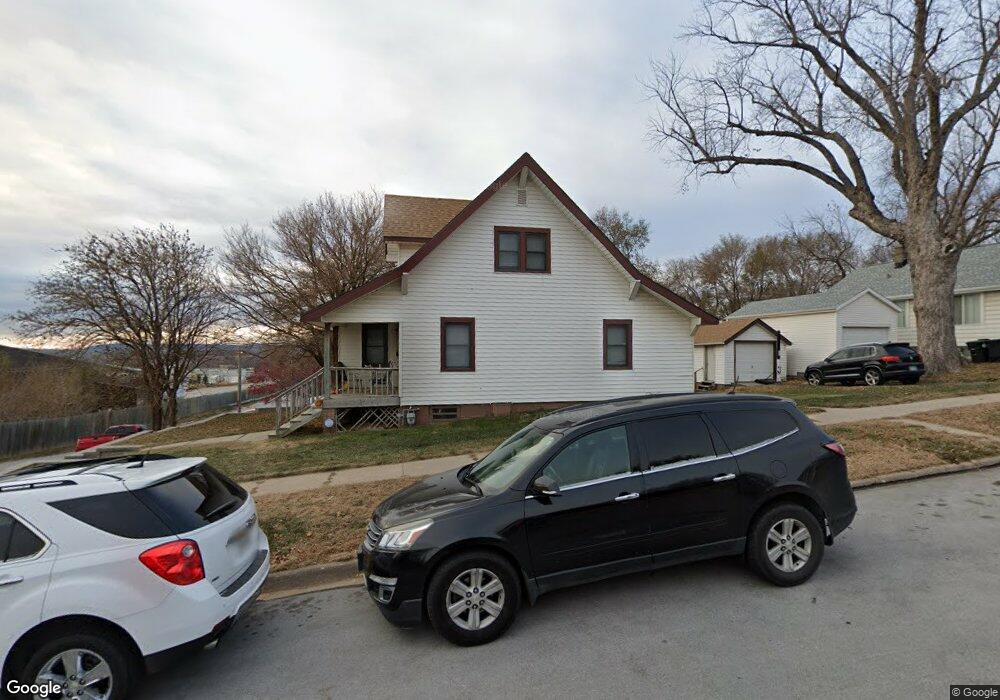
3902 S 9th St Omaha, NE 68107
South Central Omaha NeighborhoodEstimated Value: $165,000 - $207,000
3
Beds
1
Bath
1,189
Sq Ft
$151/Sq Ft
Est. Value
About This Home
This home is located at 3902 S 9th St, Omaha, NE 68107 and is currently estimated at $179,212, approximately $150 per square foot. 3902 S 9th St is a home located in Douglas County with nearby schools including Spring Lake Magnet Center, R.M. Marrs Magnet Middle School, and South High School.
Ownership History
Date
Name
Owned For
Owner Type
Purchase Details
Closed on
Oct 6, 2020
Sold by
Habitat For Humanity Of Omaha Inc
Bought by
Williams Brandon
Current Estimated Value
Home Financials for this Owner
Home Financials are based on the most recent Mortgage that was taken out on this home.
Original Mortgage
$105,219
Outstanding Balance
$93,587
Interest Rate
2.9%
Mortgage Type
Future Advance Clause Open End Mortgage
Estimated Equity
$85,625
Purchase Details
Closed on
Aug 8, 2019
Sold by
Housing Authority Of The City Of Omaha
Bought by
Habitat For Humanity Of Omaha Inc
Create a Home Valuation Report for This Property
The Home Valuation Report is an in-depth analysis detailing your home's value as well as a comparison with similar homes in the area
Home Values in the Area
Average Home Value in this Area
Purchase History
| Date | Buyer | Sale Price | Title Company |
|---|---|---|---|
| Williams Brandon | $115,000 | Nebraska Title Co | |
| Habitat For Humanity Of Omaha Inc | -- | None Available |
Source: Public Records
Mortgage History
| Date | Status | Borrower | Loan Amount |
|---|---|---|---|
| Open | Williams Brandon | $105,219 |
Source: Public Records
Tax History Compared to Growth
Tax History
| Year | Tax Paid | Tax Assessment Tax Assessment Total Assessment is a certain percentage of the fair market value that is determined by local assessors to be the total taxable value of land and additions on the property. | Land | Improvement |
|---|---|---|---|---|
| 2024 | $3,125 | $148,100 | $15,800 | $132,300 |
| 2023 | $3,125 | $148,100 | $15,800 | $132,300 |
| 2022 | $2,515 | $117,800 | $8,800 | $109,000 |
| 2021 | $1,571 | $74,200 | $8,800 | $65,400 |
| 2020 | $1,589 | $74,200 | $8,800 | $65,400 |
| 2019 | $1,933 | $0 | $0 | $0 |
| 2018 | $0 | $0 | $0 | $0 |
| 2017 | $0 | $0 | $0 | $0 |
| 2016 | $0 | $0 | $0 | $0 |
| 2015 | -- | $0 | $0 | $0 |
| 2014 | -- | $0 | $0 | $0 |
Source: Public Records
Map
Nearby Homes