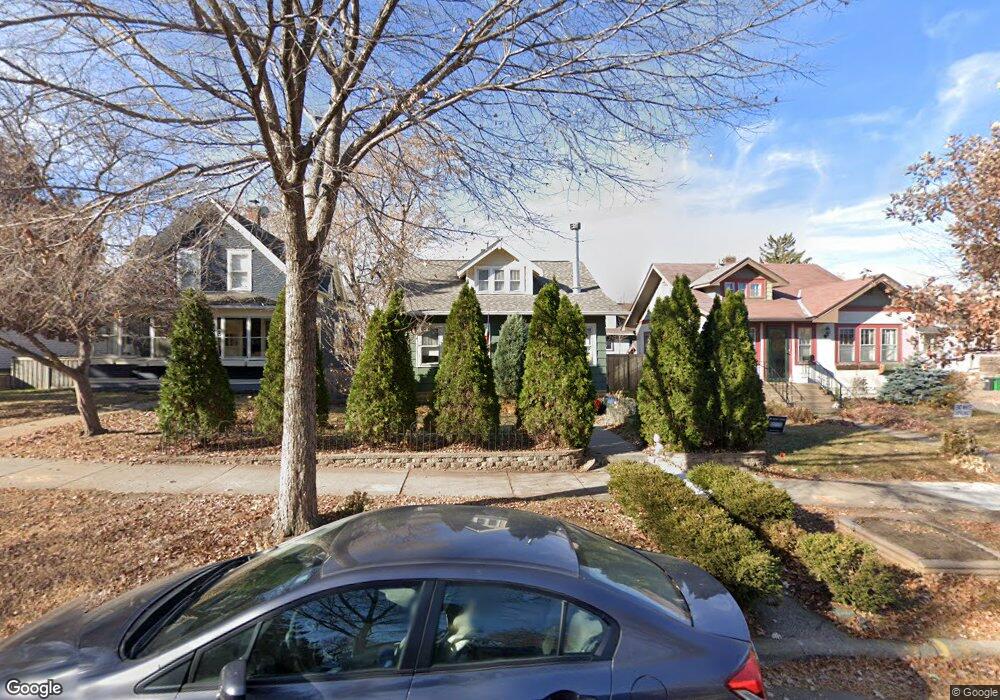
3904 17th Ave S Minneapolis, MN 55407
Bancroft NeighborhoodEstimated Value: $353,000 - $369,000
4
Beds
2
Baths
2,247
Sq Ft
$162/Sq Ft
Est. Value
About This Home
This home is located at 3904 17th Ave S, Minneapolis, MN 55407 and is currently estimated at $362,959, approximately $161 per square foot. 3904 17th Ave S is a home located in Hennepin County with nearby schools including Bancroft Elementary School, Andersen United Middle School, and Andersen Middle.
Ownership History
Date
Name
Owned For
Owner Type
Purchase Details
Closed on
Mar 10, 2020
Sold by
Rayman Rebecca A
Bought by
Chojnacki Mary Signe and Schroeder Matthew
Current Estimated Value
Home Financials for this Owner
Home Financials are based on the most recent Mortgage that was taken out on this home.
Original Mortgage
$280,250
Outstanding Balance
$248,201
Interest Rate
3.5%
Mortgage Type
New Conventional
Estimated Equity
$114,758
Purchase Details
Closed on
Feb 19, 2017
Sold by
Rayman Rebecca A
Bought by
Rayman Nataniel J and Rayman-Kinney Jasmin L
Purchase Details
Closed on
Aug 26, 2004
Sold by
Barnhill Theodore M and Barnhill Kelly M
Bought by
Rayman Rebecca A
Purchase Details
Closed on
Jan 28, 2002
Sold by
Knutson David W
Bought by
Barnhill Theodore M and Barnhill Kelly M
Purchase Details
Closed on
Oct 10, 1997
Sold by
Hud
Bought by
Knutson Elmore K and Knutson Alice V
Create a Home Valuation Report for This Property
The Home Valuation Report is an in-depth analysis detailing your home's value as well as a comparison with similar homes in the area
Home Values in the Area
Average Home Value in this Area
Purchase History
| Date | Buyer | Sale Price | Title Company |
|---|---|---|---|
| Chojnacki Mary Signe | $295,000 | Results Title | |
| Rayman Nataniel J | -- | None Available | |
| Rayman Rebecca A | $214,500 | -- | |
| Barnhill Theodore M | $120,000 | -- | |
| Knutson Elmore K | $42,000 | -- | |
| O'Banion Sarah Sarah | $415,000 | -- |
Source: Public Records
Mortgage History
| Date | Status | Borrower | Loan Amount |
|---|---|---|---|
| Open | Chojnacki Mary Signe | $280,250 | |
| Closed | O'Banion Sarah Sarah | $290,500 |
Source: Public Records
Tax History Compared to Growth
Tax History
| Year | Tax Paid | Tax Assessment Tax Assessment Total Assessment is a certain percentage of the fair market value that is determined by local assessors to be the total taxable value of land and additions on the property. | Land | Improvement |
|---|---|---|---|---|
| 2024 | $3,849 | $279,000 | $86,000 | $193,000 |
| 2023 | $3,662 | $291,000 | $86,000 | $205,000 |
| 2022 | $3,550 | $284,000 | $77,000 | $207,000 |
| 2021 | $3,216 | $268,000 | $59,000 | $209,000 |
| 2020 | $3,485 | $253,000 | $20,100 | $232,900 |
| 2019 | $3,223 | $253,000 | $13,400 | $239,600 |
| 2018 | $3,060 | $230,000 | $13,400 | $216,600 |
| 2017 | $2,763 | $196,500 | $12,200 | $184,300 |
| 2016 | $2,681 | $186,500 | $12,200 | $174,300 |
| 2015 | $2,490 | $168,500 | $12,200 | $156,300 |
| 2014 | -- | $153,500 | $12,200 | $141,300 |
Source: Public Records
Map
Nearby Homes
- 3940 16th Ave S
- 3951 17th Ave S
- 3829 Bloomington Ave
- 3836 Bloomington Ave
- 3809 Bloomington Ave
- 3952 Bloomington Ave
- 3847 Cedar Ave S
- 3924 Longfellow Ave
- 3937 14th Ave S
- 3724 Bloomington Ave
- 4100 16th Ave S
- 4040 15th Ave S Unit 10H
- 4029 14th Ave S Unit 1G
- 4029 14th Ave S Unit 14G
- 4106 16th Ave S
- 4107 18th Ave S
- 4004 19th Ave S
- 3037 15th Ave S
- 3740 13th Ave S
- 3936 21st Ave S
- 3908 17th Ave S
- 3900 17th Ave S
- 1611 E 39th St
- 3912 17th Ave S
- 3908 3908 17th-Avenue-s
- 3916 17th Ave S
- 3905 16th Ave S
- 3848 17th Ave S
- 3909 16th Ave S
- 3901 16th Ave S
- 1612 E 39th St
- 3920 17th Ave S
- 3911 16th Ave S
- 3915 16th Ave S
- 3901 17th Ave S
- 3917 16th Ave S
- 3905 17th Ave S
- 3844 17th Ave S
- 3909 17th Ave S
- 3924 17th Ave S