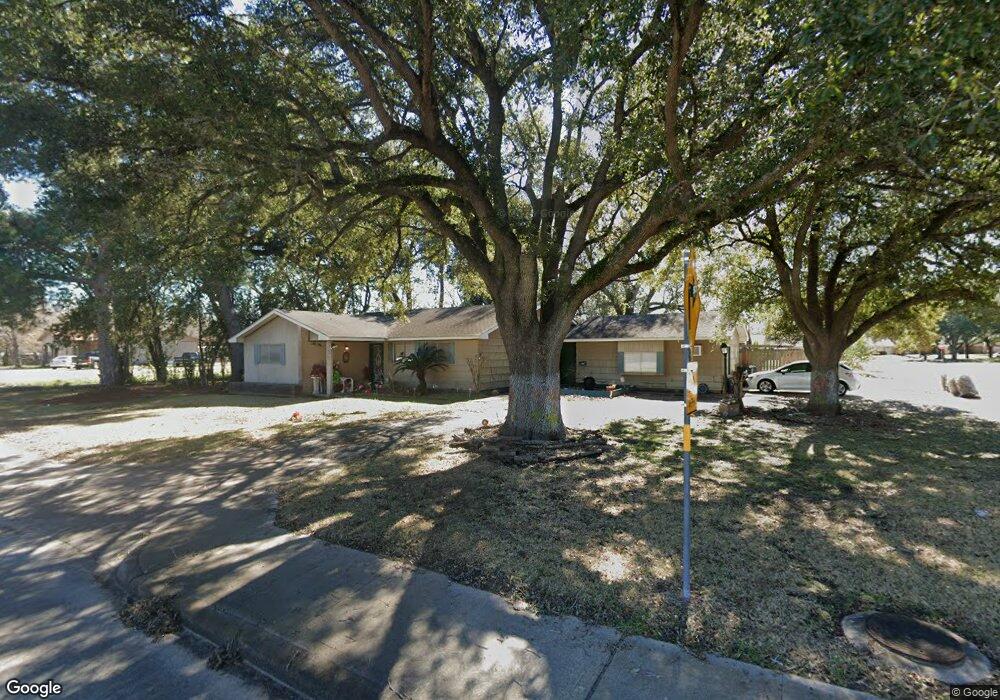
3904 Avenue N Rosenberg, TX 77471
Estimated Value: $235,303 - $296,000
3
Beds
2
Baths
1,963
Sq Ft
$128/Sq Ft
Est. Value
About This Home
This home is located at 3904 Avenue N, Rosenberg, TX 77471 and is currently estimated at $251,826, approximately $128 per square foot. 3904 Avenue N is a home located in Fort Bend County with nearby schools including Taylor Ray Elementary School, Navarro Middle School, and George Junior High School.
Ownership History
Date
Name
Owned For
Owner Type
Purchase Details
Closed on
Oct 5, 2017
Sold by
Richardson Pamela A and Green Pamela Ann
Bought by
Abundiz Pedro Gutierrez and Gutierrez Gloria Esther
Current Estimated Value
Home Financials for this Owner
Home Financials are based on the most recent Mortgage that was taken out on this home.
Original Mortgage
$104,000
Outstanding Balance
$86,962
Interest Rate
3.86%
Mortgage Type
New Conventional
Estimated Equity
$164,864
Purchase Details
Closed on
Sep 1, 2009
Sold by
Segers Evelyn O
Bought by
Richardson Pamela A and Green Janet M
Home Financials for this Owner
Home Financials are based on the most recent Mortgage that was taken out on this home.
Original Mortgage
$108,007
Interest Rate
5.2%
Mortgage Type
FHA
Create a Home Valuation Report for This Property
The Home Valuation Report is an in-depth analysis detailing your home's value as well as a comparison with similar homes in the area
Home Values in the Area
Average Home Value in this Area
Purchase History
| Date | Buyer | Sale Price | Title Company |
|---|---|---|---|
| Abundiz Pedro Gutierrez | -- | Fidelity National Title | |
| Richardson Pamela A | -- | Stewart Title Richmond | |
| Green Janet M | -- | -- |
Source: Public Records
Mortgage History
| Date | Status | Borrower | Loan Amount |
|---|---|---|---|
| Open | Abundiz Pedro Gutierrez | $104,000 | |
| Previous Owner | Green Janet M | $108,007 |
Source: Public Records
Tax History Compared to Growth
Tax History
| Year | Tax Paid | Tax Assessment Tax Assessment Total Assessment is a certain percentage of the fair market value that is determined by local assessors to be the total taxable value of land and additions on the property. | Land | Improvement |
|---|---|---|---|---|
| 2025 | $197 | $130,073 | $57,976 | $72,097 |
| 2024 | $197 | $148,760 | $57,976 | $90,784 |
| 2023 | $232 | $146,960 | $55,923 | $91,037 |
| 2022 | $1,183 | $133,600 | $51,070 | $82,530 |
| 2021 | $2,520 | $121,450 | $57,980 | $63,470 |
| 2020 | $2,597 | $122,380 | $57,980 | $64,400 |
| 2019 | $2,787 | $122,030 | $57,980 | $64,050 |
| 2018 | $2,753 | $118,600 | $57,980 | $60,620 |
| 2017 | $1,359 | $58,210 | $28,990 | $29,220 |
| 2016 | $1,360 | $58,250 | $28,990 | $29,260 |
| 2015 | $1,129 | $58,440 | $28,990 | $29,450 |
| 2014 | $1,229 | $59,140 | $28,990 | $30,150 |
Source: Public Records
Map
Nearby Homes
- 1633 Jones St
- 1803 Jones St
- 1711 Klauke St
- 3433 Avenue P
- 3608 Avenue R
- 1317 Tobola St
- 1215 Lawrence St
- 1300 Lawrence St
- 1926 Klauke Ct
- 0 Miles St
- 1733 Brumbelow St
- 1504 Radio Ln
- 1119 Tobola St
- 3604 Rychlik Dr
- 1009 Lawrence St
- 1921 Ripple Creek Dr
- 4707 E Parma Dr
- 2123 Moss Bluff Ln
- 2126 Ripple Creek Dr
- 1816 Spruce Dr
- 3904 Avenue N
- 3914 Avenue N
- 1617 Leonard St
- 3834 Avenue N
- 1621 Leonard St
- 1614 Leonard St
- 3828 Avenue N
- 1631 Leonard St
- 3829 Avenue O
- 1520 Radio Ln
- 3826 Avenue N
- 4010 Avenue N Unit 3
- 4010 Avenue N Unit 2
- 4010 Avenue N
- 3825 Avenue O
- 3822 Avenue N
- 3844 Avenue O
- 3821 Avenue O
- 1703 Avenue R
- 1620 Jones St