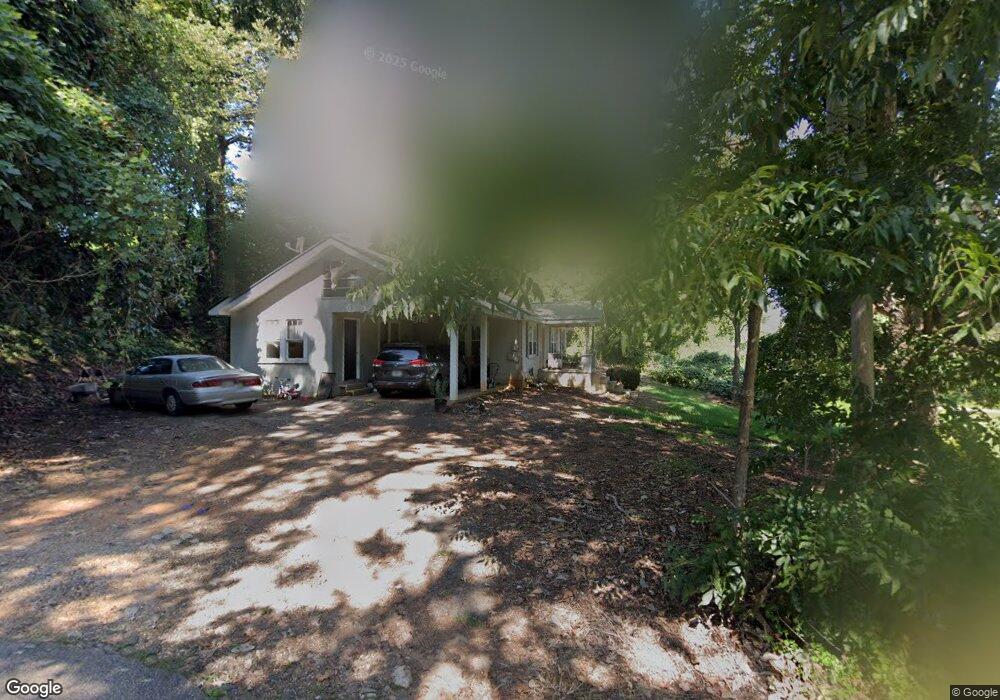
3904 C Loggins Rd Gainesville, GA 30506
Estimated Value: $192,000 - $314,000
2
Beds
1
Bath
1,320
Sq Ft
$181/Sq Ft
Est. Value
About This Home
This home is located at 3904 C Loggins Rd, Gainesville, GA 30506 and is currently estimated at $239,346, approximately $181 per square foot. 3904 C Loggins Rd is a home located in Hall County with nearby schools including Mount Vernon Elementary School, North Hall Middle School, and North Hall High School.
Ownership History
Date
Name
Owned For
Owner Type
Purchase Details
Closed on
Feb 23, 2024
Sold by
Oco Industries Llc
Bought by
Georgia State Dept Of Transportation
Current Estimated Value
Purchase Details
Closed on
Feb 12, 2024
Sold by
House Dana L
Bought by
Georgia State Dept Of Transportation
Purchase Details
Closed on
Sep 24, 2010
Sold by
Suntrust Mtg Inc
Bought by
Oco Industries Llc
Purchase Details
Closed on
Jan 5, 2010
Sold by
Ruppenthal William G and Ruppenthal Gretchen P
Bought by
Suntrust Mtg Inc
Purchase Details
Closed on
Dec 28, 2005
Sold by
Simmons Sandra
Bought by
Ruppenthal Gretchen P and Ruppenthal William G
Home Financials for this Owner
Home Financials are based on the most recent Mortgage that was taken out on this home.
Original Mortgage
$79,920
Interest Rate
6.28%
Mortgage Type
New Conventional
Purchase Details
Closed on
Sep 22, 2005
Sold by
Seabolt Cora Belle C
Bought by
Simmons Sandra
Create a Home Valuation Report for This Property
The Home Valuation Report is an in-depth analysis detailing your home's value as well as a comparison with similar homes in the area
Home Values in the Area
Average Home Value in this Area
Purchase History
| Date | Buyer | Sale Price | Title Company |
|---|---|---|---|
| Georgia State Dept Of Transportation | -- | -- | |
| Georgia State Dept Of Transportation | -- | -- | |
| Oco Industries Llc | $42,500 | -- | |
| Suntrust Mtg Inc | $83,317 | -- | |
| Suntrust Mortgage Inc | $83,300 | -- | |
| Ruppenthal Gretchen P | $99,900 | -- | |
| Simmons Sandra | -- | -- |
Source: Public Records
Mortgage History
| Date | Status | Borrower | Loan Amount |
|---|---|---|---|
| Previous Owner | Ruppenthal Gretchen P | $79,920 |
Source: Public Records
Tax History Compared to Growth
Tax History
| Year | Tax Paid | Tax Assessment Tax Assessment Total Assessment is a certain percentage of the fair market value that is determined by local assessors to be the total taxable value of land and additions on the property. | Land | Improvement |
|---|---|---|---|---|
| 2024 | $1,564 | $60,372 | $6,640 | $53,732 |
| 2023 | $1,720 | $66,692 | $6,640 | $60,052 |
| 2022 | $1,317 | $48,292 | $6,640 | $41,652 |
| 2021 | $1,101 | $39,132 | $5,960 | $33,172 |
| 2020 | $1,085 | $37,412 | $5,960 | $31,452 |
| 2019 | $1,026 | $34,932 | $5,960 | $28,972 |
| 2018 | $1,028 | $33,872 | $5,960 | $27,912 |
| 2017 | $1,018 | $33,872 | $5,960 | $27,912 |
| 2016 | $995 | $33,872 | $5,960 | $27,912 |
| 2015 | $1,003 | $33,872 | $5,960 | $27,912 |
| 2014 | $1,003 | $33,872 | $5,960 | $27,912 |
Source: Public Records
Map
Nearby Homes
- 4022 Sutton Rd Unit 25
- 4160 Topsail Ridge
- 4246 Jim Hood Rd
- 3821 N Rivercrest Dr
- 8320 Creekside Overlook
- 3610 Creekstone Dr
- 3614 Creekstone Dr
- 4193 Cleveland Hwy Unit 26
- 0 Lawson Cir Unit 10403965
- 3849 Mark Trail
- 4542 Highland Gate Pkwy Unit 63
- 4542 Highland Gate Pkwy
- 4526 Highland Gate Pkwy
- 4526 Highland Gate Pkwy Unit 67
- 4502 Highland Gate Pkwy Unit 73/74
- 4502 Highland Gate Pkwy
- 5281 Laurel Ln
- 4546 Fawn Path
- 4414 Highland Gate Pkwy
- 4478 Highland Gate Pkwy Unit 78/79
- 3901 C Loggins Rd
- 3912 C Loggins Rd
- 3905 Cleveland Hwy
- 0 Oliver Dr Unit 7389636
- 0 Oliver Dr
- 3921 Cleveland Hwy
- 4008 Oliver Dr
- 3921 C Loggins Rd
- 3930 C Loggins Rd
- 4034 C Loggins Rd
- 4035 C Loggins Rd
- 3847 Cleveland Hwy
- 3923 C Loggins Rd
- 3927 C Loggins Rd Unit 2525
- 3927 Cleveland Hwy
- 4007 Oliver Dr
- 3935 Cleveland Hwy
- 3841 Cleveland Hwy
- 3952 C Loggins Rd
- 3835 Cleveland Hwy