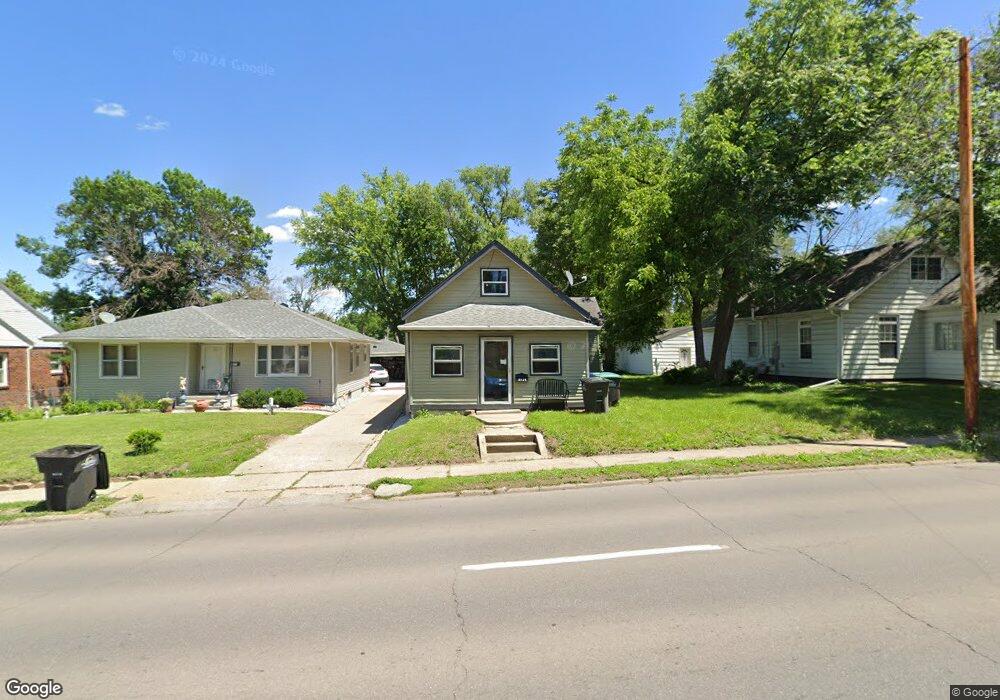
3905 2nd Ave Des Moines, IA 50313
Highland Park NeighborhoodEstimated Value: $125,000 - $156,000
2
Beds
1
Bath
872
Sq Ft
$159/Sq Ft
Est. Value
About This Home
This home is located at 3905 2nd Ave, Des Moines, IA 50313 and is currently estimated at $138,361, approximately $158 per square foot. 3905 2nd Ave is a home located in Polk County with nearby schools including Madison Elementary School, Harding Middle School, and North High School.
Ownership History
Date
Name
Owned For
Owner Type
Purchase Details
Closed on
Apr 14, 2021
Sold by
Murphy Jeffrey J
Bought by
Stanley Larry D and Stanley Rebecca A
Current Estimated Value
Purchase Details
Closed on
May 2, 2011
Sold by
Murphy Jeffrey J
Bought by
Stanley Larry D and Stanley Rebecca A
Home Financials for this Owner
Home Financials are based on the most recent Mortgage that was taken out on this home.
Original Mortgage
$30,000
Interest Rate
4.77%
Mortgage Type
Seller Take Back
Create a Home Valuation Report for This Property
The Home Valuation Report is an in-depth analysis detailing your home's value as well as a comparison with similar homes in the area
Home Values in the Area
Average Home Value in this Area
Purchase History
| Date | Buyer | Sale Price | Title Company |
|---|---|---|---|
| Stanley Larry D | $30,000 | None Available | |
| Stanley Larry D | $30,000 | None Listed On Document | |
| Stanley Larry D | -- | None Listed On Document | |
| Stanley Larry D | $30,000 | None Available |
Source: Public Records
Mortgage History
| Date | Status | Borrower | Loan Amount |
|---|---|---|---|
| Previous Owner | Stanley Larry D | $30,000 |
Source: Public Records
Tax History
| Year | Tax Paid | Tax Assessment Tax Assessment Total Assessment is a certain percentage of the fair market value that is determined by local assessors to be the total taxable value of land and additions on the property. | Land | Improvement |
|---|---|---|---|---|
| 2025 | $1,732 | $101,500 | $26,200 | $75,300 |
| 2024 | $1,732 | $88,000 | $22,800 | $65,200 |
| 2023 | $1,722 | $88,000 | $22,800 | $65,200 |
| 2022 | $1,710 | $73,100 | $19,200 | $53,900 |
| 2021 | $1,614 | $73,100 | $19,200 | $53,900 |
| 2020 | $1,678 | $64,700 | $17,200 | $47,500 |
| 2019 | $1,608 | $64,700 | $17,200 | $47,500 |
| 2018 | $1,590 | $59,800 | $15,700 | $44,100 |
| 2017 | $1,458 | $59,800 | $15,700 | $44,100 |
| 2016 | $1,420 | $53,900 | $14,100 | $39,800 |
| 2015 | $1,420 | $53,900 | $14,100 | $39,800 |
| 2014 | $1,450 | $54,600 | $14,100 | $40,500 |
Source: Public Records
Map
Nearby Homes
Your Personal Tour Guide
Ask me questions while you tour the home.