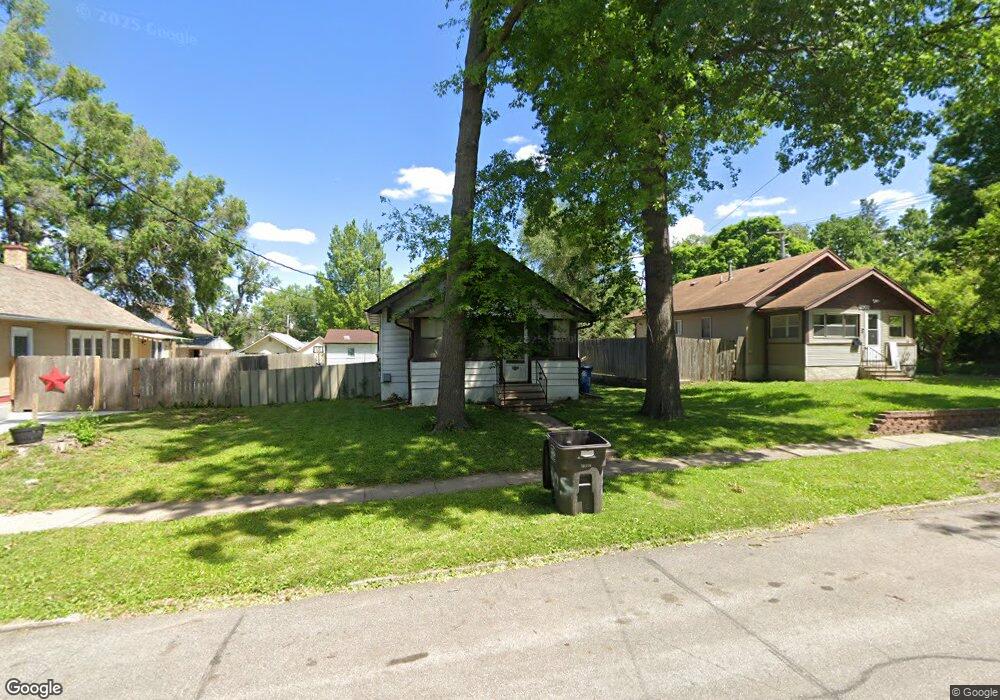
3905 3rd St Des Moines, IA 50313
Highland Park NeighborhoodEstimated Value: $130,000 - $140,500
2
Beds
1
Bath
790
Sq Ft
$169/Sq Ft
Est. Value
About This Home
This home is located at 3905 3rd St, Des Moines, IA 50313 and is currently estimated at $133,875, approximately $169 per square foot. 3905 3rd St is a home located in Polk County with nearby schools including Oak Park Elementary School, Harding Middle School, and North High School.
Ownership History
Date
Name
Owned For
Owner Type
Purchase Details
Closed on
Sep 18, 2023
Sold by
Gbd Llc
Bought by
Usa Properties Llc
Current Estimated Value
Purchase Details
Closed on
Jun 18, 2019
Sold by
Bbt Rentals Llc
Bought by
Gbd Llc
Purchase Details
Closed on
Jan 9, 2018
Sold by
Snell Holly and Citifinancial Inc
Bought by
Bbt Rentals Llc
Purchase Details
Closed on
Jan 31, 2001
Sold by
Kern Lila J
Bought by
Snell James L and Snell Holly J
Home Financials for this Owner
Home Financials are based on the most recent Mortgage that was taken out on this home.
Original Mortgage
$64,000
Interest Rate
7.22%
Purchase Details
Closed on
Feb 27, 1998
Sold by
Kern Paul F and Kern Lila J
Bought by
Kern Paul F and Kern Lila J
Purchase Details
Closed on
Nov 28, 1997
Sold by
Brazzil Robert E
Bought by
Kern Paul
Create a Home Valuation Report for This Property
The Home Valuation Report is an in-depth analysis detailing your home's value as well as a comparison with similar homes in the area
Home Values in the Area
Average Home Value in this Area
Purchase History
| Date | Buyer | Sale Price | Title Company |
|---|---|---|---|
| Usa Properties Llc | $1,100,000 | None Listed On Document | |
| Gbd Llc | -- | None Available | |
| Bbt Rentals Llc | $41,000 | None Available | |
| Snell James L | $63,500 | -- | |
| Kern Paul F | -- | -- | |
| Kern Paul | $24,000 | -- |
Source: Public Records
Mortgage History
| Date | Status | Borrower | Loan Amount |
|---|---|---|---|
| Previous Owner | Snell James L | $64,000 |
Source: Public Records
Tax History Compared to Growth
Tax History
| Year | Tax Paid | Tax Assessment Tax Assessment Total Assessment is a certain percentage of the fair market value that is determined by local assessors to be the total taxable value of land and additions on the property. | Land | Improvement |
|---|---|---|---|---|
| 2025 | $2,200 | $128,500 | $28,900 | $99,600 |
| 2024 | $2,200 | $111,800 | $25,100 | $86,700 |
| 2023 | $2,106 | $111,800 | $25,100 | $86,700 |
| 2022 | $2,090 | $89,400 | $21,200 | $68,200 |
| 2021 | $1,986 | $89,400 | $21,200 | $68,200 |
| 2020 | $2,064 | $79,600 | $19,000 | $60,600 |
| 2019 | $1,978 | $79,600 | $19,000 | $60,600 |
| 2018 | $2,450 | $73,600 | $17,300 | $56,300 |
| 2017 | $1,940 | $81,700 | $17,300 | $64,400 |
| 2016 | $1,712 | $73,700 | $15,500 | $58,200 |
| 2015 | $1,712 | $73,700 | $15,500 | $58,200 |
| 2014 | $1,748 | $74,500 | $15,500 | $59,000 |
Source: Public Records
Map
Nearby Homes