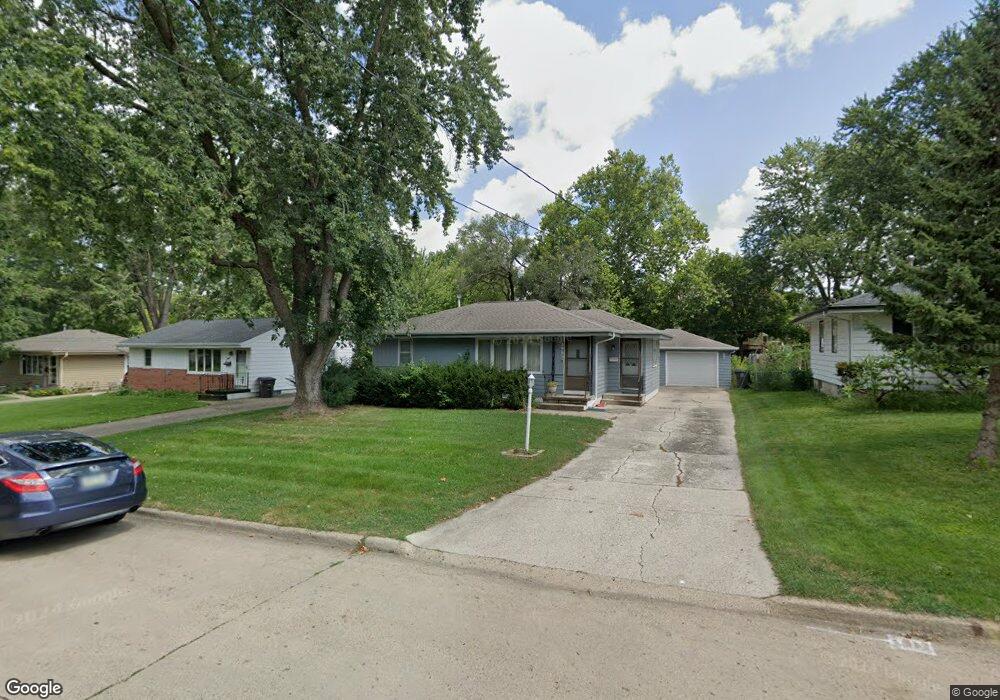
3905 55th St Des Moines, IA 50310
Merle Hay NeighborhoodEstimated Value: $235,000 - $249,000
3
Beds
1
Bath
1,487
Sq Ft
$163/Sq Ft
Est. Value
About This Home
This home is located at 3905 55th St, Des Moines, IA 50310 and is currently estimated at $242,303, approximately $162 per square foot. 3905 55th St is a home located in Polk County with nearby schools including Moore Elementary School, Meredith Middle School, and Hoover High School.
Ownership History
Date
Name
Owned For
Owner Type
Purchase Details
Closed on
Jun 19, 2002
Sold by
Barnum William D and Barnum Catherine R O
Bought by
Harms Richard R
Current Estimated Value
Home Financials for this Owner
Home Financials are based on the most recent Mortgage that was taken out on this home.
Original Mortgage
$97,520
Outstanding Balance
$41,408
Interest Rate
6.87%
Estimated Equity
$200,895
Purchase Details
Closed on
May 4, 2000
Sold by
Frueh Melvin J and Frueh Barbara J
Bought by
Barnum William D
Home Financials for this Owner
Home Financials are based on the most recent Mortgage that was taken out on this home.
Original Mortgage
$30,000
Interest Rate
7.75%
Create a Home Valuation Report for This Property
The Home Valuation Report is an in-depth analysis detailing your home's value as well as a comparison with similar homes in the area
Home Values in the Area
Average Home Value in this Area
Purchase History
| Date | Buyer | Sale Price | Title Company |
|---|---|---|---|
| Harms Richard R | $121,500 | -- | |
| Barnum William D | $109,500 | -- |
Source: Public Records
Mortgage History
| Date | Status | Borrower | Loan Amount |
|---|---|---|---|
| Open | Harms Richard R | $97,520 | |
| Previous Owner | Barnum William D | $30,000 |
Source: Public Records
Tax History
| Year | Tax Paid | Tax Assessment Tax Assessment Total Assessment is a certain percentage of the fair market value that is determined by local assessors to be the total taxable value of land and additions on the property. | Land | Improvement |
|---|---|---|---|---|
| 2025 | $4,132 | $250,400 | $47,700 | $202,700 |
| 2024 | $4,132 | $220,500 | $41,500 | $179,000 |
| 2023 | $4,184 | $220,500 | $41,500 | $179,000 |
| 2022 | $4,150 | $186,400 | $36,500 | $149,900 |
| 2021 | $4,140 | $186,400 | $36,500 | $149,900 |
| 2020 | $4,296 | $174,500 | $34,000 | $140,500 |
| 2019 | $3,958 | $174,500 | $34,000 | $140,500 |
| 2018 | $3,912 | $155,800 | $29,800 | $126,000 |
| 2017 | $3,592 | $155,800 | $29,800 | $126,000 |
| 2016 | $3,494 | $141,300 | $26,700 | $114,600 |
| 2015 | $3,494 | $141,300 | $26,700 | $114,600 |
| 2014 | $3,372 | $135,600 | $25,200 | $110,400 |
Source: Public Records
Map
Nearby Homes
Your Personal Tour Guide
Ask me questions while you tour the home.