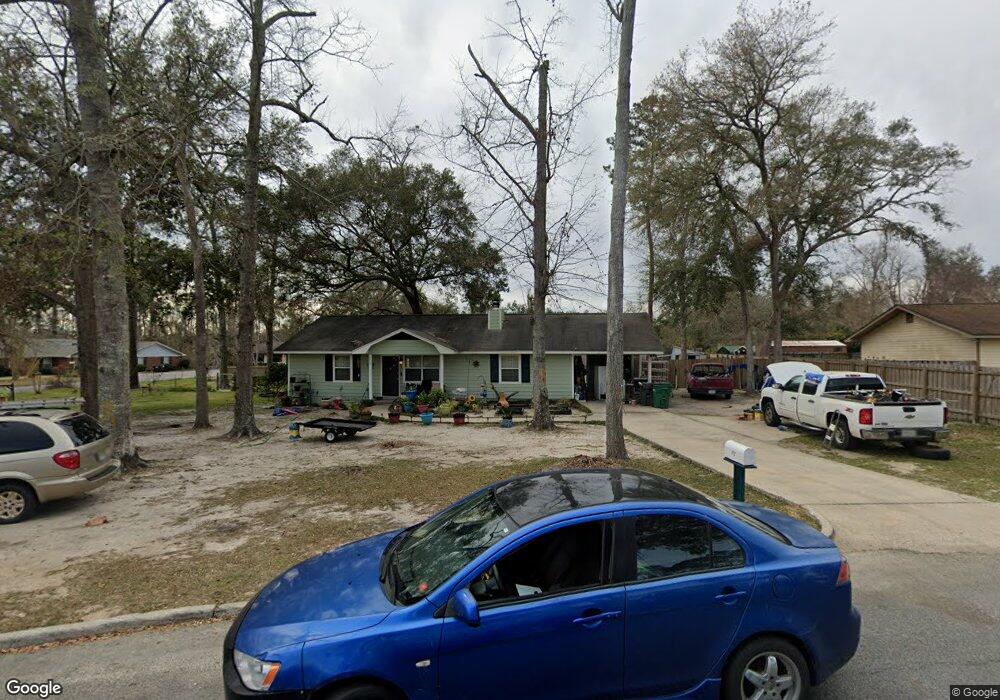
3905 Camellia Dr Valdosta, GA 31605
Estimated Value: $161,260 - $182,000
3
Beds
2
Baths
1,316
Sq Ft
$130/Sq Ft
Est. Value
About This Home
This home is located at 3905 Camellia Dr, Valdosta, GA 31605 and is currently estimated at $171,065, approximately $129 per square foot. 3905 Camellia Dr is a home located in Lowndes County with nearby schools including Dewar Elementary School, Pine Grove Middle School, and Lowndes High School.
Ownership History
Date
Name
Owned For
Owner Type
Purchase Details
Closed on
Jun 29, 2016
Sold by
Norton Connie
Bought by
Hart Leslie
Current Estimated Value
Home Financials for this Owner
Home Financials are based on the most recent Mortgage that was taken out on this home.
Original Mortgage
$79,000
Interest Rate
3.66%
Mortgage Type
New Conventional
Purchase Details
Closed on
Mar 29, 2007
Sold by
Dinkins B Robert
Bought by
Norton Connie R
Home Financials for this Owner
Home Financials are based on the most recent Mortgage that was taken out on this home.
Original Mortgage
$26,292
Interest Rate
6.15%
Mortgage Type
New Conventional
Purchase Details
Closed on
Aug 31, 2006
Sold by
Fritch Roger A
Bought by
Dinkins B Robert and Dinkins Carolyn T
Purchase Details
Closed on
Aug 1, 1985
Bought by
Fritch Roger A and Fritch Shirle
Purchase Details
Closed on
Jul 22, 1982
Bought by
Johnson James A
Purchase Details
Closed on
Jul 24, 1978
Bought by
Thompson Boyette Etal
Purchase Details
Closed on
Sep 21, 1977
Bought by
Thompson Boyette Etal
Create a Home Valuation Report for This Property
The Home Valuation Report is an in-depth analysis detailing your home's value as well as a comparison with similar homes in the area
Home Values in the Area
Average Home Value in this Area
Purchase History
| Date | Buyer | Sale Price | Title Company |
|---|---|---|---|
| Hart Leslie | $79,000 | -- | |
| Norton Connie R | $123,500 | -- | |
| Dinkins B Robert | $80,000 | -- | |
| Fritch Roger A | $47,500 | -- | |
| Johnson James A | $7,000 | -- | |
| Thompson Boyette Etal | -- | -- | |
| Thompson Boyette Etal | -- | -- |
Source: Public Records
Mortgage History
| Date | Status | Borrower | Loan Amount |
|---|---|---|---|
| Closed | Hart Leslie | $79,000 | |
| Previous Owner | Norton Connie R | $26,292 |
Source: Public Records
Tax History Compared to Growth
Tax History
| Year | Tax Paid | Tax Assessment Tax Assessment Total Assessment is a certain percentage of the fair market value that is determined by local assessors to be the total taxable value of land and additions on the property. | Land | Improvement |
|---|---|---|---|---|
| 2024 | $1,104 | $50,710 | $6,600 | $44,110 |
| 2023 | $1,104 | $45,809 | $6,600 | $39,209 |
| 2022 | $767 | $32,183 | $6,600 | $25,583 |
| 2021 | $800 | $32,183 | $6,600 | $25,583 |
| 2020 | $746 | $32,183 | $6,600 | $25,583 |
| 2019 | $753 | $32,183 | $6,600 | $25,583 |
| 2018 | $760 | $32,183 | $6,600 | $25,583 |
| 2017 | $700 | $29,858 | $6,600 | $23,258 |
| 2016 | $928 | $31,918 | $6,600 | $25,318 |
| 2015 | $890 | $31,918 | $6,600 | $25,318 |
| 2014 | $931 | $32,766 | $6,600 | $26,166 |
Source: Public Records
Map
Nearby Homes
- 383 Camellia Dr
- 3918 Camellia Dr
- 5026 Greyfield Place N
- 4111 Oak Dr
- 4114 Oak Dr Unit 8
- 3448 Bemiss Rd
- 3480 Bemiss Rd
- 646 Justin Dr
- 618 Justin Dr
- 4010 Fritz Ln
- 3604 Bellhaven Dr
- 309 Tomlinson Dr
- 3504 Breckland Dr
- 3013 Kensington Ln
- 310 Highland Heights Dr
- 2719 2nd St N
- 2703 Bemiss Rd
- 4004 Tack Trail
- 4475 Bemiss Rd
- 1.39 ac. Bemiss Rd
- 3907 Camellia Dr
- 3997 Mulberry Place
- 3903 Camellia Dr
- 3996 Mulberry Place
- 4000 Mulberry Place
- 4001 Rubra Place
- 3902 Camellia Dr
- 3995 Mulberry Place
- 3994 Mulberry Place
- 4002 Rubra Place
- 3906 Camellia Dr
- 3901 Camellia Dr
- 3900 Camellia Dr
- 5001 Peachtree St
- 3908 Camellia Dr
- 3898 Camellia Dr
- 4003 Rubra Place
- 0 Camellia Dr Unit 3197196
- 0 Camellia Dr
- 5003 Peachtree St