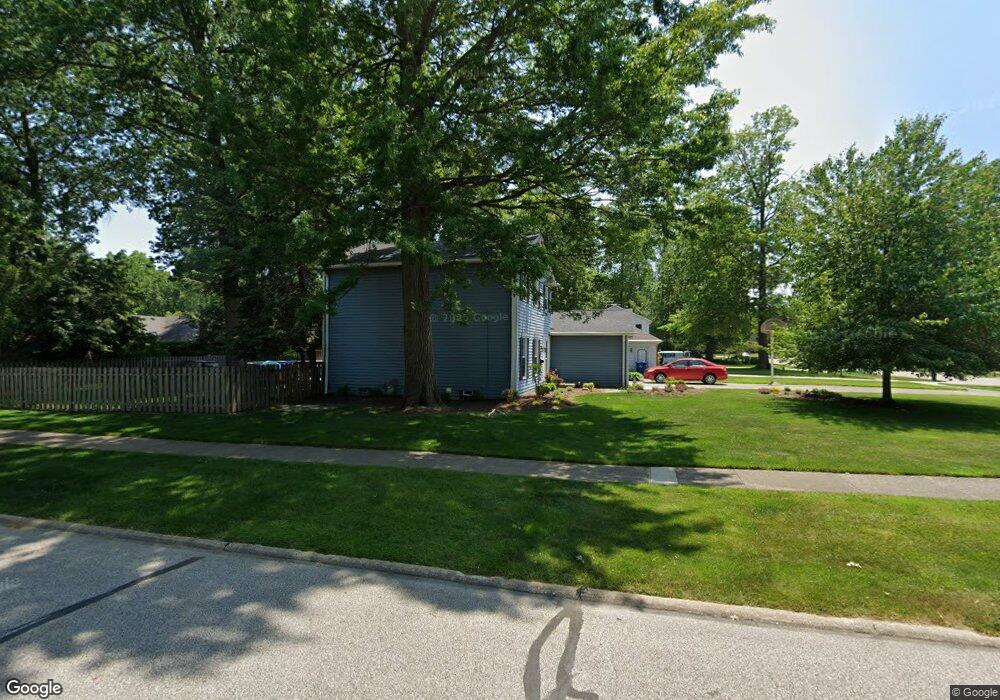
3905 Deepwoods Way North Olmsted, OH 44070
Estimated Value: $327,000 - $379,000
4
Beds
3
Baths
2,256
Sq Ft
$152/Sq Ft
Est. Value
About This Home
This home is located at 3905 Deepwoods Way, North Olmsted, OH 44070 and is currently estimated at $343,633, approximately $152 per square foot. 3905 Deepwoods Way is a home located in Cuyahoga County with nearby schools including Maple Intermediate Elementary School, Pine Intermediate School, and North Olmsted Middle School.
Ownership History
Date
Name
Owned For
Owner Type
Purchase Details
Closed on
Jan 28, 1998
Sold by
Whitmer Joseph H
Bought by
Whitmer Bonnie L
Current Estimated Value
Purchase Details
Closed on
Feb 13, 1997
Sold by
Kaczmarek Dennis F
Bought by
Whitmer Joseph H and Whitmer Bonnie L
Home Financials for this Owner
Home Financials are based on the most recent Mortgage that was taken out on this home.
Original Mortgage
$166,200
Outstanding Balance
$19,095
Interest Rate
7.74%
Mortgage Type
New Conventional
Estimated Equity
$324,538
Purchase Details
Closed on
Aug 26, 1983
Bought by
Kaczmarek Dennis F and Kaczmarek Donna M
Purchase Details
Closed on
Oct 19, 1982
Sold by
Gray William L and Gray Patricia L
Bought by
1St Federal S & L Assn
Purchase Details
Closed on
Oct 10, 1980
Bought by
Gray William L and Gray Patricia L
Purchase Details
Closed on
Jan 1, 1979
Bought by
Shore West Constr Co
Create a Home Valuation Report for This Property
The Home Valuation Report is an in-depth analysis detailing your home's value as well as a comparison with similar homes in the area
Home Values in the Area
Average Home Value in this Area
Purchase History
| Date | Buyer | Sale Price | Title Company |
|---|---|---|---|
| Whitmer Bonnie L | -- | -- | |
| Whitmer Joseph H | $175,000 | -- | |
| Kaczmarek Dennis F | -- | -- | |
| 1St Federal S & L Assn | $74,600 | -- | |
| Gray William L | $102,000 | -- | |
| Shore West Constr Co | -- | -- |
Source: Public Records
Mortgage History
| Date | Status | Borrower | Loan Amount |
|---|---|---|---|
| Open | Whitmer Joseph H | $166,200 |
Source: Public Records
Tax History Compared to Growth
Tax History
| Year | Tax Paid | Tax Assessment Tax Assessment Total Assessment is a certain percentage of the fair market value that is determined by local assessors to be the total taxable value of land and additions on the property. | Land | Improvement |
|---|---|---|---|---|
| 2024 | $7,052 | $102,900 | $21,945 | $80,955 |
| 2023 | $6,421 | $78,620 | $22,720 | $55,900 |
| 2022 | $6,387 | $78,610 | $22,720 | $55,900 |
| 2021 | $5,780 | $78,610 | $22,720 | $55,900 |
| 2020 | $5,579 | $67,200 | $19,430 | $47,780 |
| 2019 | $5,429 | $192,000 | $55,500 | $136,500 |
| 2018 | $5,506 | $67,200 | $19,430 | $47,780 |
| 2017 | $5,352 | $60,140 | $13,760 | $46,380 |
| 2016 | $5,306 | $60,140 | $13,760 | $46,380 |
| 2015 | $5,130 | $60,140 | $13,760 | $46,380 |
| 2014 | $5,130 | $57,820 | $13,230 | $44,590 |
Source: Public Records
Map
Nearby Homes
- 4187 Columbia Rd Unit 126
- 23993 Fairlawn Dr
- 3517 Walter Rd
- 24758 Doe Dr
- 25148 Tara Lynn Dr
- 25077 Doe Dr
- 3463 Clague Rd
- 4505 Oak Cir
- 25255 Maple Ridge Rd
- 25775 Briarwood Ct
- 25400 Maple Ridge Rd
- 23245 Woodview Dr
- 25324 Hall Dr
- 4590 Brendan Ln
- 25360 Hall Dr
- 4666 Brendan Cir
- 4849 Grace Rd Unit 121
- 4514 Orchard Rd
- 22976 Maple Ridge Rd Unit B 105
- 22968 Maple Ridge Rd Unit 103
- 3915 Deepwoods Way
- 3925 Deepwoods Way
- 3904 Woodside Dr
- 3914 Woodside Dr
- 24360 Deepwoods Way
- 24342 Deepwoods Way
- 3880 Woodside Dr
- 24378 Deepwoods Way
- 3924 Woodside Dr
- 3935 Deepwoods Way
- 3904 Deepwoods Way
- 3914 Deepwoods Way
- 3900 Deepwoods Way
- 3924 Deepwoods Way
- 24396 Deepwoods Way
- 3934 Woodside Dr
- 3870 Woodside Dr
- 3945 Deepwoods Way
- 3934 Deepwoods Way
- 8 Salzburg