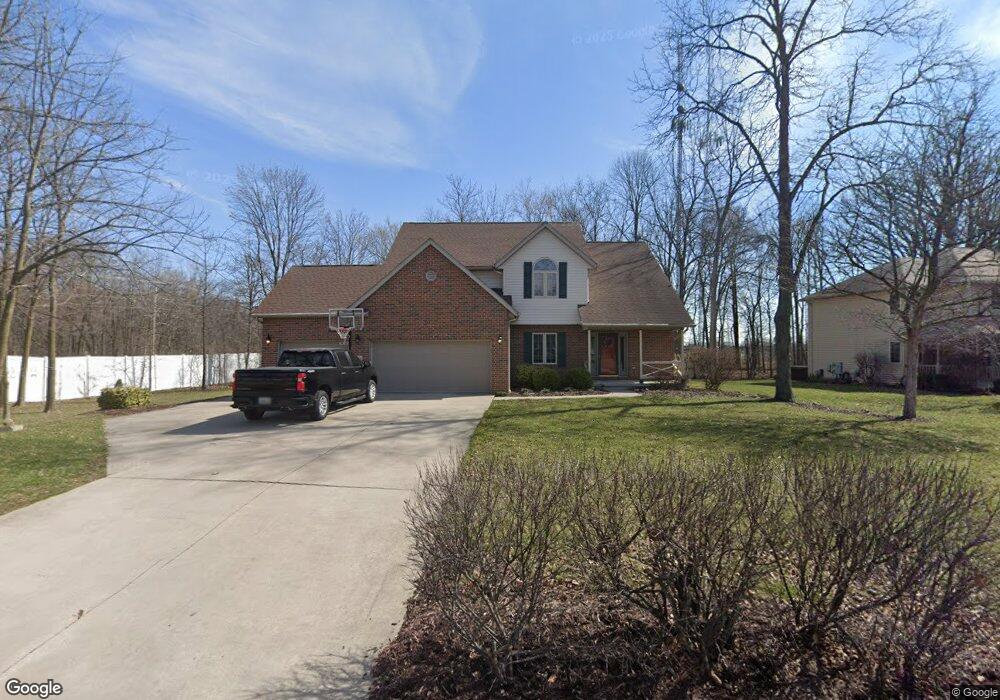
3905 Forest Tr Findlay, OH 45840
Estimated Value: $432,000 - $482,000
4
Beds
3
Baths
2,228
Sq Ft
$204/Sq Ft
Est. Value
About This Home
This home is located at 3905 Forest Tr, Findlay, OH 45840 and is currently estimated at $454,259, approximately $203 per square foot. 3905 Forest Tr is a home located in Hancock County with nearby schools including Van Buren Elementary School, Van Buren Middle School, and Van Buren High School.
Ownership History
Date
Name
Owned For
Owner Type
Purchase Details
Closed on
Feb 19, 2020
Sold by
Runge Edward J and Runge Lori L
Bought by
Stoner Brian H and Stoner Brittany J
Current Estimated Value
Home Financials for this Owner
Home Financials are based on the most recent Mortgage that was taken out on this home.
Original Mortgage
$244,000
Outstanding Balance
$216,045
Interest Rate
3.6%
Mortgage Type
New Conventional
Estimated Equity
$238,214
Purchase Details
Closed on
Jun 27, 2014
Sold by
Martin Charles J and Martin Primilla
Bought by
Runge Edward J and Runge Lori L
Home Financials for this Owner
Home Financials are based on the most recent Mortgage that was taken out on this home.
Original Mortgage
$142,500
Interest Rate
4.2%
Mortgage Type
New Conventional
Purchase Details
Closed on
May 31, 2011
Sold by
Dales Larry G and Dales Joan I
Bought by
Martin Charles and Martin Primilla
Home Financials for this Owner
Home Financials are based on the most recent Mortgage that was taken out on this home.
Original Mortgage
$192,800
Interest Rate
2.87%
Mortgage Type
New Conventional
Create a Home Valuation Report for This Property
The Home Valuation Report is an in-depth analysis detailing your home's value as well as a comparison with similar homes in the area
Purchase History
| Date | Buyer | Sale Price | Title Company |
|---|---|---|---|
| Stoner Brian H | $305,000 | Mid Am Title Agency | |
| Runge Edward J | $242,500 | Mid Am Title Agency | |
| Martin Charles | $241,000 | Attorney |
Source: Public Records
Mortgage History
| Date | Status | Borrower | Loan Amount |
|---|---|---|---|
| Open | Stoner Brian H | $244,000 | |
| Previous Owner | Runge Edward J | $142,500 | |
| Previous Owner | Martin Charles | $192,800 |
Source: Public Records
Tax History
| Year | Tax Paid | Tax Assessment Tax Assessment Total Assessment is a certain percentage of the fair market value that is determined by local assessors to be the total taxable value of land and additions on the property. | Land | Improvement |
|---|---|---|---|---|
| 2024 | $4,230 | $133,350 | $23,150 | $110,200 |
| 2023 | $4,209 | $133,350 | $23,150 | $110,200 |
| 2022 | $4,210 | $133,350 | $23,150 | $110,200 |
| 2021 | $4,162 | $124,230 | $21,580 | $102,650 |
| 2020 | $4,158 | $124,230 | $21,580 | $102,650 |
| 2019 | $4,302 | $124,230 | $21,580 | $102,650 |
| 2018 | $3,790 | $108,030 | $18,770 | $89,260 |
| 2017 | $3,803 | $108,030 | $18,770 | $89,260 |
| 2016 | $3,674 | $108,030 | $18,770 | $89,260 |
| 2015 | $3,069 | $87,840 | $18,770 | $69,070 |
| 2014 | $3,081 | $87,840 | $18,770 | $69,070 |
| 2012 | $3,270 | $85,850 | $18,770 | $67,080 |
Source: Public Records
Map
Nearby Homes
- 3815 Forest Trail Dr
- 0 Bushwillow Dr Or Rock Candy Rd Unit Lot 157
- 0 Bearcat Way Or Rock Candy Rd Unit Lot 167
- 0 Rock Candy Rd Or Bushwillow Dr Unit Lot 173
- 0 Rock Candy Rd Unit Lot 159
- 0 Rock Candy Rd Unit Lot 170
- 0 Rock Candy Rd Unit Lot 172 206819
- 0 Rock Candy Rd Unit Lot 162
- 0 Rock Candy Rd Unit Lot 171
- 0 Rock Candy Rd Unit Lot 168
- 0 Allen Township 142
- 3206 Turnberry Dr
- 3237 Gleneagle Dr
- 3106 Saddlebrook
- 9894 Smokies Way
- 3018 Gleneagle Dr
- 0 Township Highway 99
- 12325 Township Highway 99
- 6535 Silver Lake Dr
- 0 County Road 95 Unit 6097574
- 3845 Forest Trail Dr
- 1600 White Tail Run
- 3840 Forest Trail Dr
- 1015 Township Road 99 Rd
- 3820 Forest Trail Dr
- 3805 Forest Trail Dr
- 1620 Silver Creek Dr
- 1545 Silver Creek Dr
- 3740 Forest Trail Dr
- 1660 Silver Creek Dr
- 10603 County Road 99
- 1625 Silver Creek Dr
- 10532 County Road 99
- 0 Forest Trail Dr Unit H110587
- 0 Forest Trail Dr Unit H123968
- 0 Forest Trail Dr Unit H123606
- 0 Forest Trail Dr Unit H126079
- 0 Forest Trail Dr Unit H126946
- 0 Forest Trail Dr Unit H134743
- 12 Forest Trail Dr
Your Personal Tour Guide
Ask me questions while you tour the home.