Estimated Value: $352,000 - $440,000
3
Beds
2
Baths
1,144
Sq Ft
$343/Sq Ft
Est. Value
About This Home
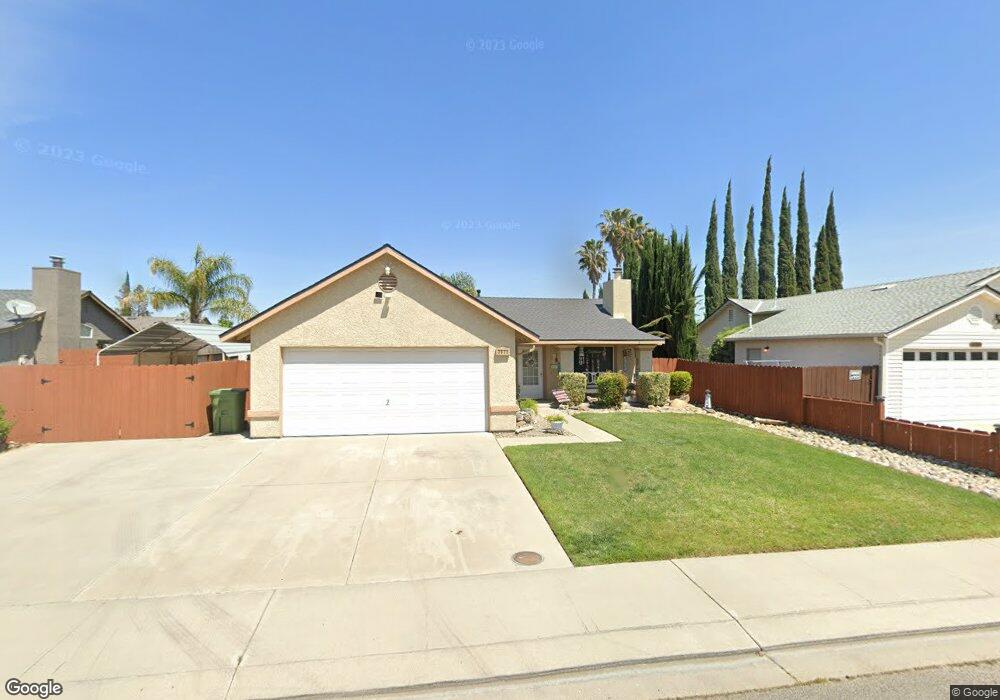
This home is located at 3905 Gable Way, Ceres, CA 95307 and is currently estimated at $392,476, approximately $343 per square foot. 3905 Gable Way is a home located in Stanislaus County with nearby schools including Keyes Elementary School, Barbara Spratling Middle School, and Turlock Junior High School.
Ownership History
Date
Name
Owned For
Owner Type
Purchase Details
Closed on
Dec 23, 1996
Sold by
Northlanding Homes Inc
Bought by
Lafromboise Wilfred F and Lafromboise Tammy A
Current Estimated Value
Home Financials for this Owner
Home Financials are based on the most recent Mortgage that was taken out on this home.
Original Mortgage
$92,996
Outstanding Balance
$9,308
Interest Rate
7.53%
Mortgage Type
FHA
Estimated Equity
$383,168
Purchase Details
Closed on
Sep 19, 1996
Sold by
Mitchell Properties
Bought by
Northlanding Homes Inc
Home Financials for this Owner
Home Financials are based on the most recent Mortgage that was taken out on this home.
Original Mortgage
$71,400
Interest Rate
7.87%
Mortgage Type
Construction
Create a Home Valuation Report for This Property
The Home Valuation Report is an in-depth analysis detailing your home's value as well as a comparison with similar homes in the area
Home Values in the Area
Average Home Value in this Area
Purchase History
| Date | Buyer | Sale Price | Title Company |
|---|---|---|---|
| Lafromboise Wilfred F | $94,000 | First American Title Co | |
| Northlanding Homes Inc | $23,500 | First American Title Co |
Source: Public Records
Mortgage History
| Date | Status | Borrower | Loan Amount |
|---|---|---|---|
| Open | Lafromboise Wilfred F | $92,996 | |
| Previous Owner | Northlanding Homes Inc | $71,400 |
Source: Public Records
Tax History
| Year | Tax Paid | Tax Assessment Tax Assessment Total Assessment is a certain percentage of the fair market value that is determined by local assessors to be the total taxable value of land and additions on the property. | Land | Improvement |
|---|---|---|---|---|
| 2025 | $1,825 | $152,268 | $39,082 | $113,186 |
| 2024 | $1,744 | $149,283 | $38,316 | $110,967 |
| 2023 | $1,734 | $146,357 | $37,565 | $108,792 |
| 2022 | $1,710 | $143,488 | $36,829 | $106,659 |
| 2021 | $1,683 | $140,675 | $36,107 | $104,568 |
| 2020 | $1,662 | $139,233 | $35,737 | $103,496 |
| 2019 | $1,636 | $136,504 | $35,037 | $101,467 |
| 2018 | $1,648 | $133,828 | $34,350 | $99,478 |
| 2017 | $1,595 | $131,205 | $33,677 | $97,528 |
| 2016 | $1,589 | $128,633 | $33,017 | $95,616 |
| 2015 | $1,534 | $126,702 | $32,522 | $94,180 |
| 2014 | $1,510 | $124,221 | $31,885 | $92,336 |
Source: Public Records
Map
Nearby Homes
- 4837 Faith Home Rd Unit 162
- 4837 Faith Home Rd Unit 102
- 4837 Faith Home Rd Unit 4
- 4837 Faith Home Rd Unit 177
- 4837 Faith Home Rd Unit 136
- 4837 Faith Home Rd Unit 26
- 5208 9th St
- 4806 Ariel St
- 5214 Amaryllis Way
- 4637 Zoe Ave
- 3221 E Redwood Rd
- 4413 Maud Ave
- 5601 Stella Ave
- 3724 Lockwood Rd
- 5900 Washington Rd
- 5000 Nunes Rd
- 3524 Homestead Way Unit 57
- 3012 Donner Dr Unit 32
- 3550 Mitchell Rd Unit 59
- 6630 Foote Rd
- 3901 Gable Way
- 3909 Gable Way
- 3904 Bacall Way
- 3908 Bacall Way
- 3900 Bacall Way
- 5100 Monroe Way
- 3813 Gable Ct
- 3913 Gable Way
- 3912 Bacall Way
- 3908 Gable Way
- 3816 Bacall Way
- 3916 Bacall Way
- 5104 Monroe Way
- 3809 Gable Ct
- 3912 Gable Way
- 3917 Gable Way
- 5101 Monroe Way
- 3812 Bacall Way
- 3920 Bacall Way
- 3905 Bacall Way
Your Personal Tour Guide
Ask me questions while you tour the home.