3905 Marsh Creek Rd Raleigh, NC 27604
Northeast Raleigh NeighborhoodEstimated Value: $332,704 - $370,000
3
Beds
2
Baths
1,655
Sq Ft
$214/Sq Ft
Est. Value
About This Home
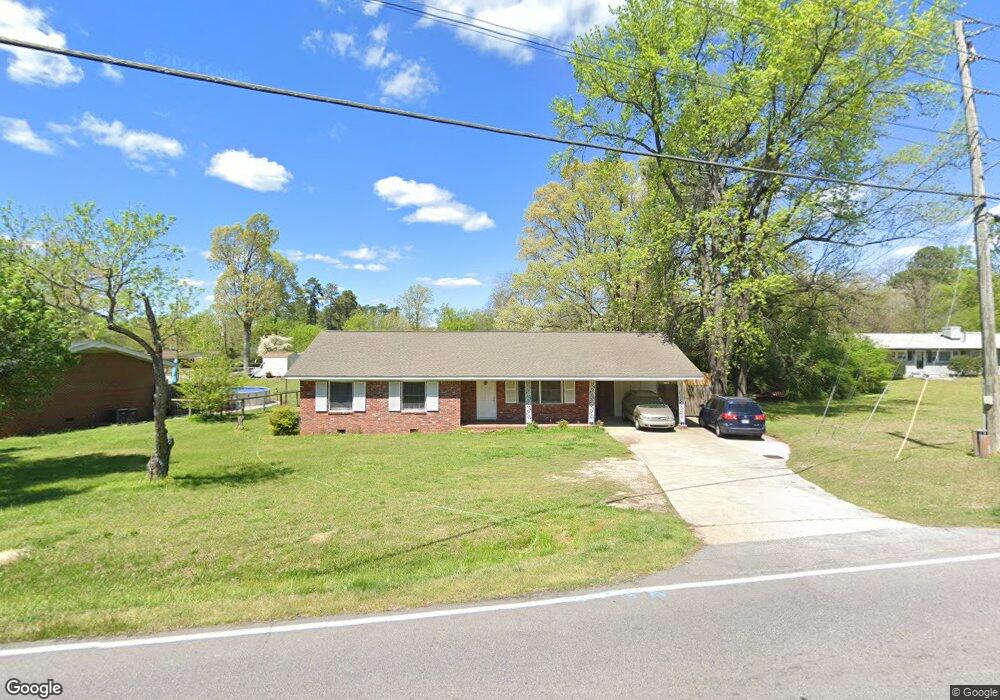
This home is located at 3905 Marsh Creek Rd, Raleigh, NC 27604 and is currently estimated at $354,926, approximately $214 per square foot. 3905 Marsh Creek Rd is a home located in Wake County with nearby schools including Wilburn Elementary, Durant Road Middle, and Heritage High School.
Ownership History
Date
Name
Owned For
Owner Type
Purchase Details
Closed on
Aug 29, 2024
Sold by
Igboko Dennis U and Igboko Anthonia O
Bought by
Igboko Family Living Trust and Igboko
Current Estimated Value
Purchase Details
Closed on
Sep 12, 2002
Sold by
The Bank Of New York
Bought by
Igboko Anthonia O
Home Financials for this Owner
Home Financials are based on the most recent Mortgage that was taken out on this home.
Original Mortgage
$99,900
Interest Rate
6.21%
Purchase Details
Closed on
Mar 1, 2002
Sold by
Thomas Johnny J and Thomas Geraldine V
Bought by
Bank Of New York
Purchase Details
Closed on
Mar 23, 1999
Sold by
Austin Tommy Lee
Bought by
Thomas Johnny
Home Financials for this Owner
Home Financials are based on the most recent Mortgage that was taken out on this home.
Original Mortgage
$116,462
Interest Rate
6.74%
Mortgage Type
FHA
Create a Home Valuation Report for This Property
The Home Valuation Report is an in-depth analysis detailing your home's value as well as a comparison with similar homes in the area
Home Values in the Area
Average Home Value in this Area
Purchase History
| Date | Buyer | Sale Price | Title Company |
|---|---|---|---|
| Igboko Family Living Trust | -- | None Listed On Document | |
| Igboko Anthonia O | $111,000 | -- | |
| Bank Of New York | $124,598 | -- | |
| Thomas Johnny | $120,000 | -- |
Source: Public Records
Mortgage History
| Date | Status | Borrower | Loan Amount |
|---|---|---|---|
| Previous Owner | Igboko Anthonia O | $99,900 | |
| Previous Owner | Thomas Johnny | $116,462 |
Source: Public Records
Tax History Compared to Growth
Tax History
| Year | Tax Paid | Tax Assessment Tax Assessment Total Assessment is a certain percentage of the fair market value that is determined by local assessors to be the total taxable value of land and additions on the property. | Land | Improvement |
|---|---|---|---|---|
| 2025 | $2,567 | $292,058 | $85,500 | $206,558 |
| 2024 | $2,557 | $292,058 | $85,500 | $206,558 |
| 2023 | $2,065 | $187,633 | $57,600 | $130,033 |
| 2022 | $1,920 | $187,633 | $57,600 | $130,033 |
| 2021 | $1,846 | $187,633 | $57,600 | $130,033 |
| 2020 | $1,812 | $187,633 | $57,600 | $130,033 |
| 2019 | $1,667 | $142,092 | $45,000 | $97,092 |
| 2018 | $1,573 | $142,092 | $45,000 | $97,092 |
| 2017 | $1,498 | $142,092 | $45,000 | $97,092 |
| 2016 | $1,468 | $142,092 | $45,000 | $97,092 |
| 2015 | $1,522 | $145,035 | $43,200 | $101,835 |
| 2014 | -- | $145,035 | $43,200 | $101,835 |
Source: Public Records
Map
Nearby Homes
- 2817 Roundleaf Ct
- 2737 Andover Glen Rd
- 2800 Dove Ln
- 2761 Andover Glen Rd
- 2848 Roundleaf Ct
- 2716 Dove Ln
- 3001 Pinehurst Dr
- 4400 Knightsbridge Way
- 2977 Faversham Place
- 4309 Birmingham Way
- 2704 Rockbridge Ct
- 2509 Westham Place
- 511 Edgecreek Ct
- 4109 Stonewall Dr
- 3636 Water Mist Ln
- 2712 Kempsford Place
- 3600 Star Trek Ct
- 3635 Water Mist Ln
- 2400 Dorety Place
- 4905 Knightsbridge Way
- 3901 Marsh Creek Rd
- 3006 Lark Cir
- 4001 Marsh Creek Rd
- 3010 Lark Cir
- 3928 Marsh Creek Rd
- 3924 Marsh Creek Rd
- 3847 Marsh Creek Rd
- 4000 Marsh Creek Rd
- 4003 Marsh Creek Rd
- 3007 Lark Cir
- 3904 Marsh Creek Rd
- 3009 Lark Cir
- 3845 Marsh Creek Rd
- 4004 Haithcock Rd
- 4008 Haithcock Rd
- 4000 Haithcock Rd
- 4014 Haithcock Rd
- 2916 Dove Ln
- 3966 Haithcock Rd
- 2917 Field St