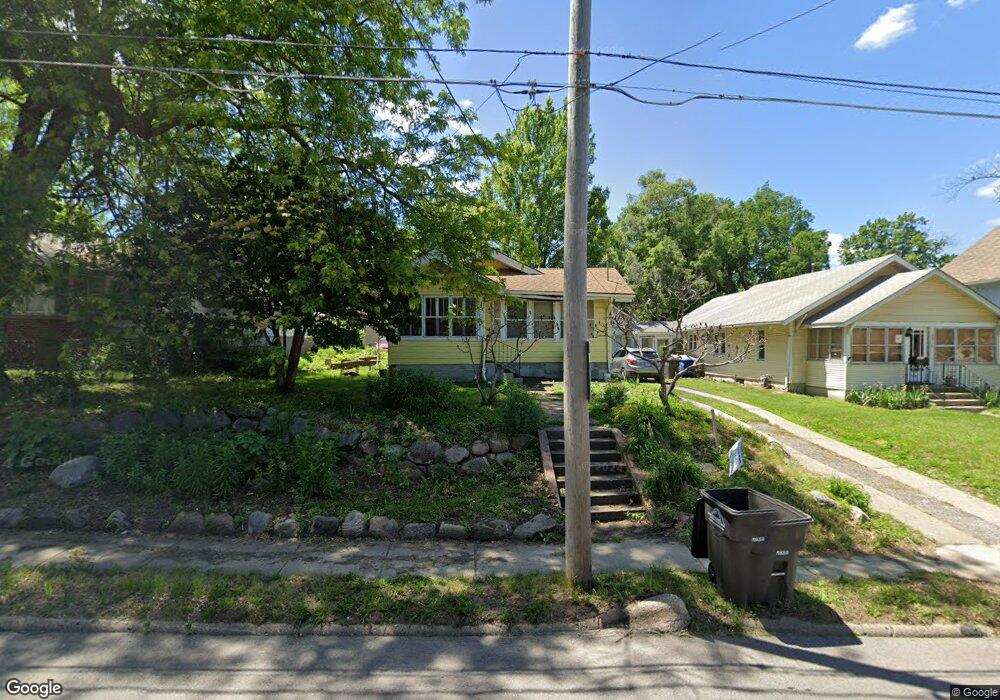
3906 2nd Ave Des Moines, IA 50313
Highland Park NeighborhoodEstimated Value: $107,000 - $156,000
2
Beds
1
Bath
838
Sq Ft
$152/Sq Ft
Est. Value
About This Home
This home is located at 3906 2nd Ave, Des Moines, IA 50313 and is currently estimated at $127,606, approximately $152 per square foot. 3906 2nd Ave is a home located in Polk County with nearby schools including Oak Park Elementary School, Harding Middle School, and North High School.
Ownership History
Date
Name
Owned For
Owner Type
Purchase Details
Closed on
Mar 31, 2017
Sold by
Contract Exchange Corporation
Bought by
Arias Jose Torres and Carmen Martinez M Maria Del
Current Estimated Value
Purchase Details
Closed on
Dec 6, 2016
Sold by
Mccarthy Bill
Bought by
Wells Fargo Bank N A
Purchase Details
Closed on
Apr 15, 1997
Sold by
Ewing Lydia Lucille
Bought by
Faris Ivalyn M
Home Financials for this Owner
Home Financials are based on the most recent Mortgage that was taken out on this home.
Original Mortgage
$46,550
Interest Rate
7.92%
Create a Home Valuation Report for This Property
The Home Valuation Report is an in-depth analysis detailing your home's value as well as a comparison with similar homes in the area
Home Values in the Area
Average Home Value in this Area
Purchase History
| Date | Buyer | Sale Price | Title Company |
|---|---|---|---|
| Arias Jose Torres | -- | None Available | |
| Wells Fargo Bank N A | $25,000 | None Available | |
| Faris Ivalyn M | $49,000 | -- |
Source: Public Records
Mortgage History
| Date | Status | Borrower | Loan Amount |
|---|---|---|---|
| Previous Owner | Faris Ivalyn M | $46,550 |
Source: Public Records
Tax History
| Year | Tax Paid | Tax Assessment Tax Assessment Total Assessment is a certain percentage of the fair market value that is determined by local assessors to be the total taxable value of land and additions on the property. | Land | Improvement |
|---|---|---|---|---|
| 2025 | $1,890 | $122,900 | $26,100 | $96,800 |
| 2024 | $1,890 | $106,500 | $22,600 | $83,900 |
| 2023 | $1,842 | $106,500 | $22,600 | $83,900 |
| 2022 | $1,826 | $87,000 | $19,100 | $67,900 |
| 2021 | $1,710 | $87,000 | $19,100 | $67,900 |
| 2020 | $1,770 | $77,100 | $17,100 | $60,000 |
| 2019 | $1,682 | $77,100 | $17,100 | $60,000 |
| 2018 | $1,660 | $71,100 | $15,500 | $55,600 |
| 2017 | $1,634 | $71,100 | $15,500 | $55,600 |
| 2016 | $1,496 | $64,200 | $14,000 | $50,200 |
| 2015 | $1,462 | $64,200 | $14,000 | $50,200 |
| 2014 | $1,434 | $64,900 | $14,000 | $50,900 |
Source: Public Records
Map
Nearby Homes
Your Personal Tour Guide
Ask me questions while you tour the home.