Estimated Value: $714,000 - $788,000
4
Beds
2
Baths
1,873
Sq Ft
$394/Sq Ft
Est. Value
About This Home
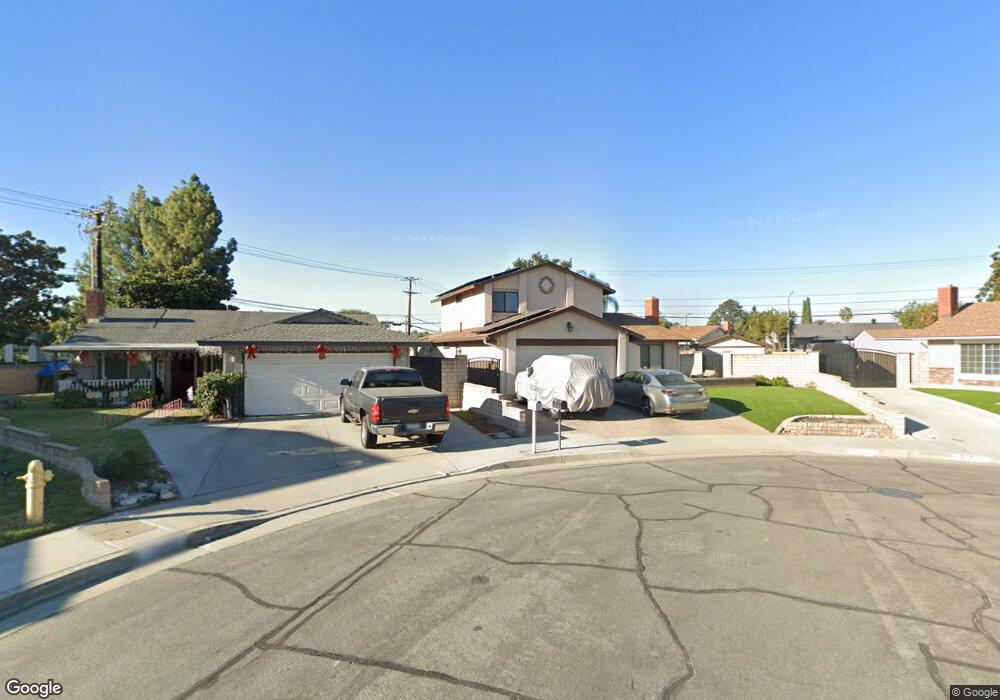
This home is located at 3906 Jose Ct, Chino, CA 91710 and is currently estimated at $737,605, approximately $393 per square foot. 3906 Jose Ct is a home located in San Bernardino County with nearby schools including Dickson Elementary, Ramona Junior High School, and Don Antonio Lugo High School.
Ownership History
Date
Name
Owned For
Owner Type
Purchase Details
Closed on
Jun 17, 2003
Sold by
Collins John P and Collins Diane R
Bought by
Collins John P and Collins Diane R
Current Estimated Value
Purchase Details
Closed on
Nov 14, 2002
Sold by
Collins Diane R and Langridge Diane R
Bought by
Collins John P and Collins Diane R
Create a Home Valuation Report for This Property
The Home Valuation Report is an in-depth analysis detailing your home's value as well as a comparison with similar homes in the area
Home Values in the Area
Average Home Value in this Area
Purchase History
| Date | Buyer | Sale Price | Title Company |
|---|---|---|---|
| Collins John P | -- | -- | |
| Collins John P | -- | Southland Title |
Source: Public Records
Tax History Compared to Growth
Tax History
| Year | Tax Paid | Tax Assessment Tax Assessment Total Assessment is a certain percentage of the fair market value that is determined by local assessors to be the total taxable value of land and additions on the property. | Land | Improvement |
|---|---|---|---|---|
| 2025 | $1,581 | $150,808 | $18,464 | $132,344 |
| 2024 | $1,581 | $147,851 | $18,102 | $129,749 |
| 2023 | $1,536 | $144,952 | $17,747 | $127,205 |
| 2022 | $1,526 | $142,110 | $17,399 | $124,711 |
| 2021 | $1,494 | $139,324 | $17,058 | $122,266 |
| 2020 | $1,475 | $137,895 | $16,883 | $121,012 |
| 2019 | $1,448 | $135,191 | $16,552 | $118,639 |
| 2018 | $1,415 | $132,540 | $16,227 | $116,313 |
| 2017 | $1,388 | $129,941 | $15,909 | $114,032 |
| 2016 | $1,297 | $127,393 | $15,597 | $111,796 |
| 2015 | $1,270 | $125,480 | $15,363 | $110,117 |
| 2014 | $1,244 | $123,022 | $15,062 | $107,960 |
Source: Public Records
Map
Nearby Homes
- 3947 Jose Ct
- 13798 Roswell Ave
- 13640 Norton Ave
- 3516 Larkwood Dr
- 13401 Wisteria Place
- 13639 Meadow Crest Dr
- 4449 Carmen St
- 4440 Carmen St
- 4621 Chino Ave
- 3185 Skyview Ridge
- 4539 Carmen St
- 4524 Carmen St
- 3557 Riverside Dr
- 12958 Boston Ave
- 3107 Greenacre Rd
- 3778 Pilgrims Way
- 0 Pilgrims Way
- 3786 Daisy Dr
- 4912 G St
- 3546 Garden Ct