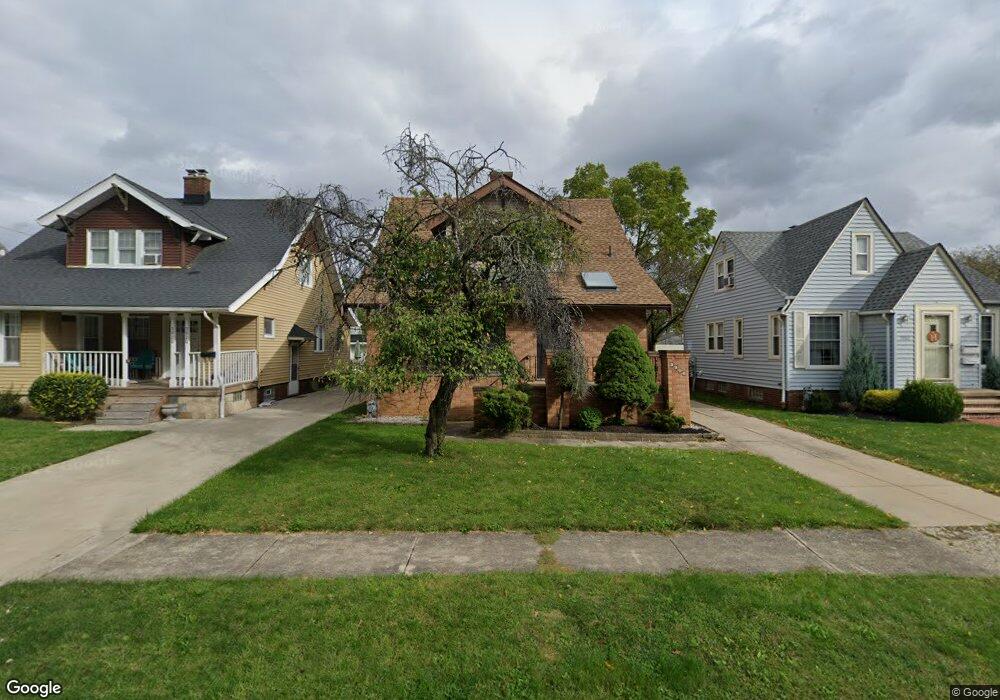
3906 Maplecrest Ave Cleveland, OH 44134
Estimated Value: $199,358 - $228,000
3
Beds
2
Baths
1,409
Sq Ft
$153/Sq Ft
Est. Value
About This Home
This home is located at 3906 Maplecrest Ave, Cleveland, OH 44134 and is currently estimated at $215,090, approximately $152 per square foot. 3906 Maplecrest Ave is a home located in Cuyahoga County with nearby schools including Shiloh Middle School, John Muir Elementary School, and Normandy High School.
Ownership History
Date
Name
Owned For
Owner Type
Purchase Details
Closed on
Dec 20, 2018
Sold by
Craig Martha O and Craig Donlad J
Bought by
Craig Martha O and Craig Donlad J
Current Estimated Value
Purchase Details
Closed on
Dec 3, 2018
Sold by
Craig Donald J and Craig Martha O
Bought by
Craig Martha O and Craig Donald J
Purchase Details
Closed on
Nov 1, 2017
Sold by
Iwaniuk Nancy J
Bought by
Craig Donald J
Purchase Details
Closed on
Nov 8, 2011
Sold by
Estate Of Orest P Iwaniuk
Bought by
Iwaniuk Nancy J
Purchase Details
Closed on
Dec 21, 1992
Sold by
Iwaniuk Petronela
Bought by
Iwaniuk Petonela
Purchase Details
Closed on
Jun 27, 1991
Sold by
Iwaniuk Orest S
Bought by
Iwaniuk Petronela
Purchase Details
Closed on
Oct 8, 1987
Sold by
Iwaniuk Orest S and Iwaniuk Petronela
Bought by
Iwaniuk Orest S
Purchase Details
Closed on
Jan 1, 1975
Bought by
Iwaniuk Orest S and Iwaniuk Petronela
Create a Home Valuation Report for This Property
The Home Valuation Report is an in-depth analysis detailing your home's value as well as a comparison with similar homes in the area
Home Values in the Area
Average Home Value in this Area
Purchase History
| Date | Buyer | Sale Price | Title Company |
|---|---|---|---|
| Craig Martha O | -- | None Available | |
| Craig Martha O | -- | None Available | |
| Craig Donald J | $50,000 | None Available | |
| Iwaniuk Nancy J | -- | Attorney | |
| Iwaniuk Petonela | -- | -- | |
| Iwaniuk Petronela | -- | -- | |
| Iwaniuk Orest S | -- | -- | |
| Iwaniuk Orest S | -- | -- |
Source: Public Records
Tax History
| Year | Tax Paid | Tax Assessment Tax Assessment Total Assessment is a certain percentage of the fair market value that is determined by local assessors to be the total taxable value of land and additions on the property. | Land | Improvement |
|---|---|---|---|---|
| 2024 | $3,754 | $62,160 | $10,080 | $52,080 |
| 2023 | $2,975 | $41,730 | $8,020 | $33,710 |
| 2022 | $2,946 | $41,720 | $8,020 | $33,710 |
| 2021 | $3,030 | $41,720 | $8,020 | $33,710 |
| 2020 | $2,654 | $32,100 | $6,160 | $25,940 |
| 2019 | $2,540 | $91,700 | $17,600 | $74,100 |
| 2018 | $2,434 | $32,100 | $6,160 | $25,940 |
| 2017 | $2,474 | $28,280 | $4,830 | $23,450 |
| 2016 | $2,460 | $28,280 | $4,830 | $23,450 |
| 2015 | $2,471 | $28,280 | $4,830 | $23,450 |
| 2014 | $2,471 | $30,420 | $5,180 | $25,240 |
Source: Public Records
Map
Nearby Homes
- 3716 Grantwood Dr
- 3407 Wellington Ave
- 4515 Albertly Ave
- 4115 Sheraton Dr
- 3406 Marioncliff Dr
- 3202 Parklane Dr
- 4809 Wellington Ave
- 3303 Ingleside Dr
- 3255 Woodlawn Dr
- 3319 Norris Ave
- 4918 Yorkshire Ave
- 3109 George Ave
- 3103 Norris Ave
- 4011 Liggett Dr
- 3323 Dellwood Dr
- 3214 Liggett Dr
- 5916 W 54th St
- 5611 Brownfield Dr
- 5610 Renwood Dr
- 3440 Winthrop Dr
- 3910 Maplecrest Ave
- 3902 Maplecrest Ave
- 3914 Maplecrest Ave
- 3810 Maplecrest Ave
- 3907 Redfern Rd
- 3911 Redfern Rd
- 3903 Redfern Rd
- 3915 Redfern Rd
- 3811 Redfern Rd
- 3802 Maplecrest Ave
- 4006 Maplecrest Ave
- 4003 Redfern Rd
- 3907 Maplecrest Ave
- 3807 Redfern Rd
- 3911 Maplecrest Ave
- 3905 Maplecrest Ave
- 3915 Maplecrest Ave
- 4007 Redfern Rd
- 3710 Maplecrest Ave
- 4010 Maplecrest Ave
Your Personal Tour Guide
Ask me questions while you tour the home.