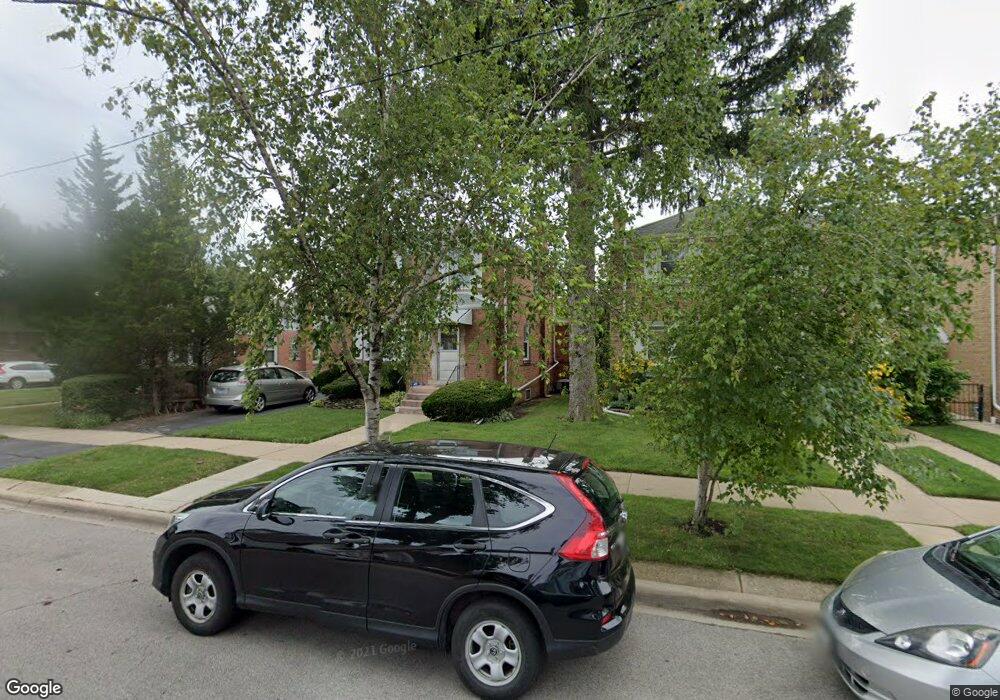
3906 N Page Ave Chicago, IL 60634
Irving Woods NeighborhoodEstimated Value: $442,770 - $492,000
4
Beds
3
Baths
1,592
Sq Ft
$290/Sq Ft
Est. Value
About This Home
This home is located at 3906 N Page Ave, Chicago, IL 60634 and is currently estimated at $462,443, approximately $290 per square foot. 3906 N Page Ave is a home located in Cook County with nearby schools including Canty Elementary School, Steinmetz College Prep, and St. Francis Borgia School.
Ownership History
Date
Name
Owned For
Owner Type
Purchase Details
Closed on
Jan 24, 2019
Sold by
Chicago Title Land Trust Co
Bought by
Tukiendorf Jadwiga
Current Estimated Value
Purchase Details
Closed on
Dec 12, 2015
Sold by
Tukiendorf Boguslaw and Tukiendorf Jadwiga
Bought by
Chicago Title Land Trust Company and Trust #8002370004
Purchase Details
Closed on
Oct 18, 2001
Sold by
Hamad Marian
Bought by
Tukiendorf Boguslaw and Tukiendorf Jadwiga
Home Financials for this Owner
Home Financials are based on the most recent Mortgage that was taken out on this home.
Original Mortgage
$196,000
Interest Rate
6.88%
Purchase Details
Closed on
May 9, 1996
Sold by
Lasalle National Trust Na
Bought by
Hamad Mariam
Home Financials for this Owner
Home Financials are based on the most recent Mortgage that was taken out on this home.
Original Mortgage
$130,400
Interest Rate
7.78%
Mortgage Type
Balloon
Create a Home Valuation Report for This Property
The Home Valuation Report is an in-depth analysis detailing your home's value as well as a comparison with similar homes in the area
Home Values in the Area
Average Home Value in this Area
Purchase History
| Date | Buyer | Sale Price | Title Company |
|---|---|---|---|
| Tukiendorf Jadwiga | -- | Chicago Title | |
| Chicago Title Land Trust Company | -- | Cti | |
| Tukiendorf Boguslaw | $245,000 | -- | |
| Hamad Mariam | $163,000 | -- |
Source: Public Records
Mortgage History
| Date | Status | Borrower | Loan Amount |
|---|---|---|---|
| Previous Owner | Tukiendorf Boguslaw | $196,000 | |
| Previous Owner | Hamad Mariam | $130,400 |
Source: Public Records
Tax History Compared to Growth
Tax History
| Year | Tax Paid | Tax Assessment Tax Assessment Total Assessment is a certain percentage of the fair market value that is determined by local assessors to be the total taxable value of land and additions on the property. | Land | Improvement |
|---|---|---|---|---|
| 2024 | $5,497 | $38,000 | $13,950 | $24,050 |
| 2023 | $5,320 | $32,000 | $11,160 | $20,840 |
| 2022 | $5,320 | $32,000 | $11,160 | $20,840 |
| 2021 | $5,234 | $32,005 | $11,165 | $20,840 |
| 2020 | $5,589 | $30,658 | $6,975 | $23,683 |
| 2019 | $5,607 | $34,065 | $6,975 | $27,090 |
| 2018 | $3,790 | $34,065 | $6,975 | $27,090 |
| 2017 | $4,058 | $26,334 | $6,138 | $20,196 |
| 2016 | $4,419 | $26,334 | $6,138 | $20,196 |
| 2015 | $4,828 | $26,334 | $6,138 | $20,196 |
| 2014 | $4,704 | $25,335 | $5,580 | $19,755 |
| 2013 | $3,791 | $25,335 | $5,580 | $19,755 |
Source: Public Records
Map
Nearby Homes
- 3841 N Page Ave
- 3842 N Paris Ave
- 3759 N Pioneer Ave
- 3725 N Pacific Ave
- 3643 N Pacific Ave
- 3916 N Pontiac Ave
- 7707 W Irving Park Rd Unit 303
- 7649 W Irving Park Rd
- 4127 N Ozark Ave
- 4234 N Ozark Ave
- 4236 N Ozark Ave
- 8164 W Forest Preserve Ave Unit 2N
- 3649 N Overhill Ave
- 8350 W Addison St Unit 101
- 4109 N Ottawa Ave
- 3919 N Oriole Ave
- 3443 N Page Ave
- 4212 N Ottawa Ave
- 8255 W Agatite Ave
- 3952 N Oleander Ave
- 3900 N Page Ave
- 3908 N Page Ave
- 3912 N Page Ave
- 3916 N Page Ave
- 3920 N Page Ave
- 3905 N Panama Ave
- 3909 N Panama Ave
- 3858 N Page Ave
- 3901 N Panama Ave
- 3911 N Panama Ave
- 3915 N Panama Ave
- 3922 N Page Ave
- 3854 N Page Ave
- 3905 N Page Ave
- 3909 N Page Ave
- 3901 N Page Ave
- 3919 N Panama Ave
- 3915 N Page Ave
- 3852 N Page Ave
- 3917 N Page Ave