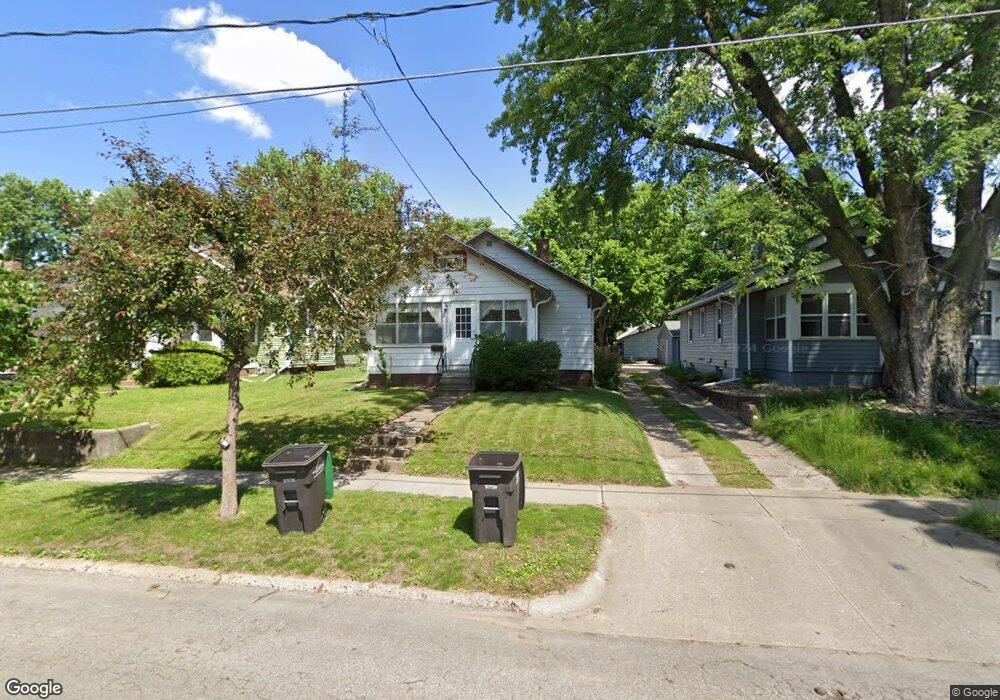
3907 Cambridge St Des Moines, IA 50313
Highland Park NeighborhoodEstimated Value: $160,502 - $181,000
2
Beds
1
Bath
750
Sq Ft
$226/Sq Ft
Est. Value
About This Home
This home is located at 3907 Cambridge St, Des Moines, IA 50313 and is currently estimated at $169,126, approximately $225 per square foot. 3907 Cambridge St is a home located in Polk County with nearby schools including Madison Elementary School, Harding Middle School, and North High School.
Ownership History
Date
Name
Owned For
Owner Type
Purchase Details
Closed on
Aug 7, 1997
Sold by
Margaret A Hurley Trust
Bought by
Flisher Robert E and Flisher Chris E
Current Estimated Value
Home Financials for this Owner
Home Financials are based on the most recent Mortgage that was taken out on this home.
Original Mortgage
$50,964
Interest Rate
8%
Mortgage Type
VA
Create a Home Valuation Report for This Property
The Home Valuation Report is an in-depth analysis detailing your home's value as well as a comparison with similar homes in the area
Home Values in the Area
Average Home Value in this Area
Purchase History
| Date | Buyer | Sale Price | Title Company |
|---|---|---|---|
| Flisher Robert E | $49,500 | -- |
Source: Public Records
Mortgage History
| Date | Status | Borrower | Loan Amount |
|---|---|---|---|
| Previous Owner | Flisher Robert E | $50,964 |
Source: Public Records
Tax History Compared to Growth
Tax History
| Year | Tax Paid | Tax Assessment Tax Assessment Total Assessment is a certain percentage of the fair market value that is determined by local assessors to be the total taxable value of land and additions on the property. | Land | Improvement |
|---|---|---|---|---|
| 2025 | $2,494 | $158,000 | $26,300 | $131,700 |
| 2024 | $2,494 | $137,200 | $22,800 | $114,400 |
| 2023 | $2,380 | $137,200 | $22,800 | $114,400 |
| 2022 | $2,360 | $109,900 | $19,200 | $90,700 |
| 2021 | $2,228 | $109,900 | $19,200 | $90,700 |
| 2020 | $2,310 | $97,900 | $17,200 | $80,700 |
| 2019 | $2,198 | $97,900 | $17,200 | $80,700 |
| 2018 | $2,170 | $90,300 | $15,600 | $74,700 |
| 2017 | $1,976 | $90,300 | $15,600 | $74,700 |
| 2016 | $1,920 | $81,600 | $14,100 | $67,500 |
| 2015 | $1,920 | $81,600 | $14,100 | $67,500 |
| 2014 | $1,866 | $78,900 | $13,500 | $65,400 |
Source: Public Records
Map
Nearby Homes
- 3911 Cambridge St
- 3905 Cambridge St
- 3913 Cambridge St
- 3901 Cambridge St
- 3915 Cambridge St
- 3906 Cornell St
- 3910 Cornell St
- 3904 Cornell St
- 3904 Cambridge St
- 3912 Cornell St
- 3900 Cornell St
- 3917 Cambridge St
- 3912 Cambridge St
- 3914 Cornell St
- 148 E Seneca Ave
- 3847 Cambridge St
- 3921 Cambridge St
- 3916 Cambridge St
- 3916 Cornell St
- 3848 Cornell St