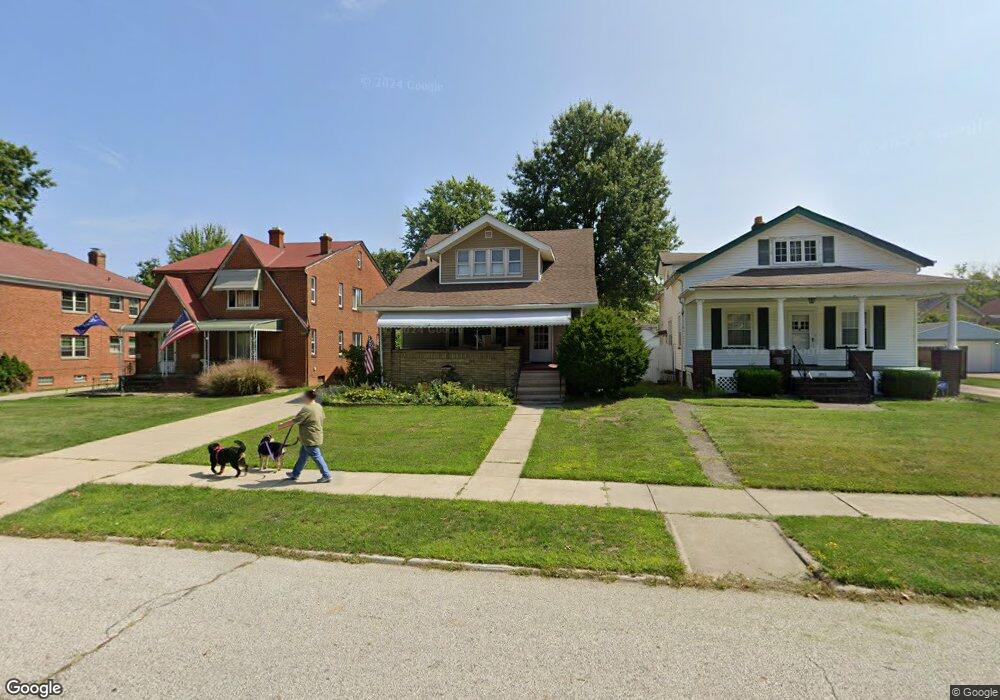
3907 W 160th St Cleveland, OH 44111
Kamm's Corners NeighborhoodEstimated Value: $249,000 - $266,020
3
Beds
1
Bath
1,931
Sq Ft
$135/Sq Ft
Est. Value
About This Home
This home is located at 3907 W 160th St, Cleveland, OH 44111 and is currently estimated at $260,005, approximately $134 per square foot. 3907 W 160th St is a home located in Cuyahoga County with nearby schools including Artemus Ward School, Almira Academy, and Anton Grdina School.
Ownership History
Date
Name
Owned For
Owner Type
Purchase Details
Closed on
May 23, 2001
Sold by
Reed Wayne E
Bought by
Lemieux Russell W and Lemieux Susan H
Current Estimated Value
Home Financials for this Owner
Home Financials are based on the most recent Mortgage that was taken out on this home.
Original Mortgage
$94,000
Outstanding Balance
$35,203
Interest Rate
7.07%
Mortgage Type
VA
Estimated Equity
$224,802
Purchase Details
Closed on
Mar 30, 2001
Sold by
Reed Jane G
Bought by
Reed Wayne E
Home Financials for this Owner
Home Financials are based on the most recent Mortgage that was taken out on this home.
Original Mortgage
$94,000
Outstanding Balance
$35,203
Interest Rate
7.07%
Mortgage Type
VA
Estimated Equity
$224,802
Purchase Details
Closed on
Feb 21, 1980
Sold by
Reed Jane G
Bought by
Reed Wayne E
Purchase Details
Closed on
Feb 17, 1976
Sold by
Reed Wayne E and Reed Jane J
Bought by
Reed Jane G
Purchase Details
Closed on
Jan 1, 1975
Bought by
Reed Wayne E and Reed Jane J
Create a Home Valuation Report for This Property
The Home Valuation Report is an in-depth analysis detailing your home's value as well as a comparison with similar homes in the area
Home Values in the Area
Average Home Value in this Area
Purchase History
| Date | Buyer | Sale Price | Title Company |
|---|---|---|---|
| Lemieux Russell W | $94,000 | Prospect Title Agency Inc | |
| Reed Wayne E | -- | Midland Title Security Inc | |
| Reed Wayne E | -- | -- | |
| Reed Jane G | -- | -- | |
| Reed Wayne E | -- | -- |
Source: Public Records
Mortgage History
| Date | Status | Borrower | Loan Amount |
|---|---|---|---|
| Open | Lemieux Russell W | $94,000 |
Source: Public Records
Tax History Compared to Growth
Tax History
| Year | Tax Paid | Tax Assessment Tax Assessment Total Assessment is a certain percentage of the fair market value that is determined by local assessors to be the total taxable value of land and additions on the property. | Land | Improvement |
|---|---|---|---|---|
| 2024 | $4,576 | $79,590 | $14,875 | $64,715 |
| 2023 | $3,579 | $56,360 | $12,080 | $44,280 |
| 2022 | $3,590 | $56,350 | $12,080 | $44,280 |
| 2021 | $3,554 | $56,350 | $12,080 | $44,280 |
| 2020 | $2,987 | $43,330 | $9,280 | $34,060 |
| 2019 | $2,762 | $123,800 | $26,500 | $97,300 |
| 2018 | $2,503 | $43,330 | $9,280 | $34,060 |
| 2017 | $2,272 | $36,300 | $8,160 | $28,140 |
| 2016 | $2,254 | $36,300 | $8,160 | $28,140 |
| 2015 | $1,992 | $36,300 | $8,160 | $28,140 |
| 2014 | $1,992 | $33,010 | $7,420 | $25,590 |
Source: Public Records
Map
Nearby Homes
- 3918 W 160th St
- 3942 W 160th St
- 15804 Chatfield Ave
- 4049 W 157th St
- 4096 W 161st St
- 3726 W 169th St
- 3619 Rockport Ave
- 3739 Warren Rd
- 17301 Bradgate Ave
- 17202 Melgrave Ave
- 3693 Warren Rd
- 16717 Valleyview Ave
- 17706 Susan Ave
- 17517 Oxford Ave
- 17705 Susan Ave
- 3472 W 159th St
- 3615 W 147th St
- 4267 W 162nd St
- 3549 Warren Rd
- 15537 Munn Rd
- 3901 W 160th St
- 3913 W 160th St
- 3893 W 160th St
- 3919 W 160th St
- 3887 W 160th St
- 3908 W 158th St
- 3904 W 158th St
- 3923 W 160th St
- 3912 W 158th St
- 3916 W 158th St
- 3900 W 158th St
- 3896 W 158th St
- 3920 W 158th St
- 3929 W 160th St
- 3881 W 160th St
- 3890 W 158th St
- 3924 W 158th St
- 3906 W 160th St
- 3898 W 160th St
- 3912 W 160th St