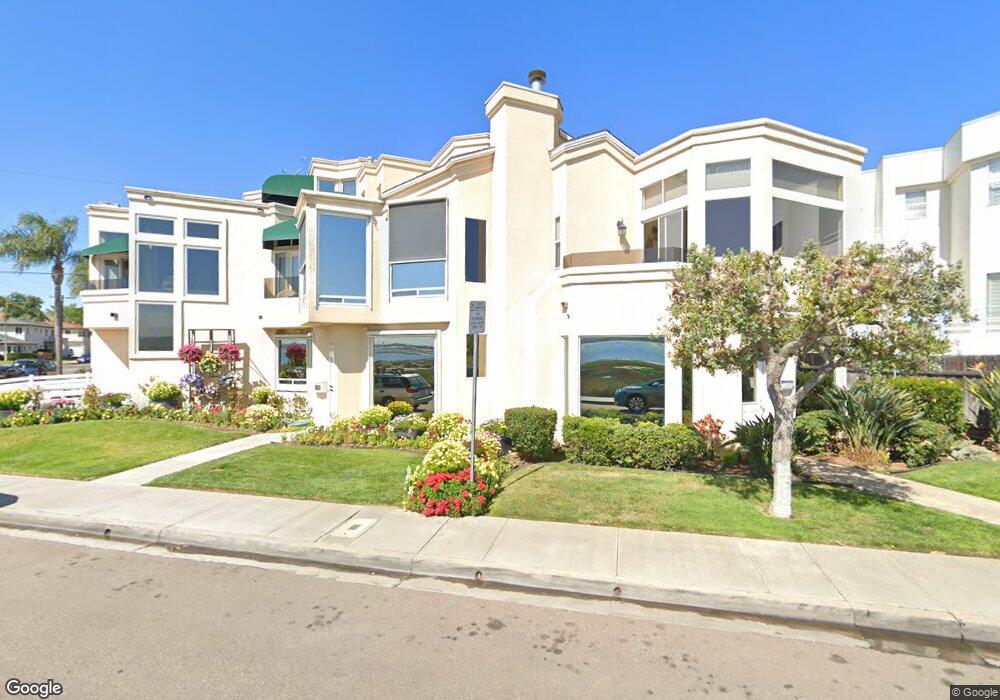
3908 Crown Point Dr Unit 1 San Diego, CA 92109
Pacific Beach NeighborhoodEstimated Value: $1,246,000 - $1,342,810
3
Beds
4
Baths
1,447
Sq Ft
$904/Sq Ft
Est. Value
About This Home
This home is located at 3908 Crown Point Dr Unit 1, San Diego, CA 92109 and is currently estimated at $1,308,203, approximately $904 per square foot. 3908 Crown Point Dr Unit 1 is a home located in San Diego County with nearby schools including Crown Point Junior Music Academy, Pacific Beach Middle, and Mission Bay High School.
Ownership History
Date
Name
Owned For
Owner Type
Purchase Details
Closed on
Jul 17, 2019
Sold by
Visse Richard H and Visse Sandra L
Bought by
Visse Richard H and Visse Sandra L
Current Estimated Value
Purchase Details
Closed on
Dec 12, 1995
Sold by
Devco Rdc
Bought by
Visse Richard H and Visse Sandra L
Home Financials for this Owner
Home Financials are based on the most recent Mortgage that was taken out on this home.
Original Mortgage
$224,000
Outstanding Balance
$4,583
Interest Rate
7.37%
Estimated Equity
$1,303,620
Purchase Details
Closed on
Nov 7, 1995
Sold by
Dixon Kenneth W and Dixon Jean M
Bought by
Devco Rdc
Home Financials for this Owner
Home Financials are based on the most recent Mortgage that was taken out on this home.
Original Mortgage
$224,000
Outstanding Balance
$4,583
Interest Rate
7.37%
Estimated Equity
$1,303,620
Purchase Details
Closed on
Jun 12, 1992
Purchase Details
Closed on
Jun 8, 1990
Create a Home Valuation Report for This Property
The Home Valuation Report is an in-depth analysis detailing your home's value as well as a comparison with similar homes in the area
Home Values in the Area
Average Home Value in this Area
Purchase History
| Date | Buyer | Sale Price | Title Company |
|---|---|---|---|
| Visse Richard H | -- | None Available | |
| Visse Richard H | -- | None Available | |
| Visse Richard H | $280,000 | First American Title | |
| Devco Rdc | $305,000 | First American Title Co | |
| -- | $304,500 | -- | |
| -- | $260,000 | -- |
Source: Public Records
Mortgage History
| Date | Status | Borrower | Loan Amount |
|---|---|---|---|
| Open | Visse Richard H | $224,000 |
Source: Public Records
Tax History Compared to Growth
Tax History
| Year | Tax Paid | Tax Assessment Tax Assessment Total Assessment is a certain percentage of the fair market value that is determined by local assessors to be the total taxable value of land and additions on the property. | Land | Improvement |
|---|---|---|---|---|
| 2025 | $5,632 | $465,129 | $299,016 | $166,113 |
| 2024 | $5,632 | $456,009 | $293,153 | $162,856 |
| 2023 | $5,508 | $447,068 | $287,405 | $159,663 |
| 2022 | $5,362 | $438,303 | $281,770 | $156,533 |
| 2021 | $5,325 | $429,710 | $276,246 | $153,464 |
| 2020 | $6,797 | $550,189 | $415,594 | $134,595 |
| 2019 | $5,167 | $416,966 | $268,053 | $148,913 |
| 2018 | $4,832 | $408,792 | $262,798 | $145,994 |
| 2017 | $4,717 | $400,778 | $257,646 | $143,132 |
| 2016 | $4,642 | $392,921 | $252,595 | $140,326 |
| 2015 | $4,574 | $387,020 | $248,801 | $138,219 |
| 2014 | $4,502 | $379,440 | $243,928 | $135,512 |
Source: Public Records
Map
Nearby Homes
- 3955 Honeycutt St Unit 201
- 3968 Sequoia St
- 3955 Shasta St
- 4015 Crown Point Dr Unit 308
- 4064 Honeycutt St
- 4073 Kendall St Unit 2
- 4036 Shasta St Unit 14
- 1703 La Playa Ave Unit B
- 4053-55 Jewell St
- 3943 Ingraham St
- 2023 Reed Ave Unit 1A
- 1654 Oliver Ave Unit 6
- 2134 Reed Ave
- 1830 Thomas Ave Unit 3D
- 3736 Promontory St
- 4037 Haines St
- 2028 Thomas Ave Unit 32
- 3712 Promontory St
- 3843 Riviera Dr Unit 1
- 3705 Haines St
- 3904 Crown Point Dr
- 3906 Crown Point Dr
- 3920 Crown Point Dr Unit L4
- 3918 Crown Point Dr
- 3914 Crown Point Dr
- 3916 Crown Point Dr Unit L2
- 3926 Honeycutt St Unit 2
- 3926 Honeycutt St Unit 4
- 3926 Honeycutt St Unit 3
- 3926 Honeycutt St Unit 1
- 1910 Roosevelt Ave Unit 6
- 1910 Roosevelt Ave Unit 5
- 1910 Roosevelt Ave Unit 4
- 1910 Roosevelt Ave Unit 3
- 1910 Roosevelt Ave Unit 2
- 1910 Roosevelt Ave Unit 1
- 3909 Lamont St Unit 15
- 3923 Lamont St
- 3930 Honeycutt St
- 3925-31 Lamont St