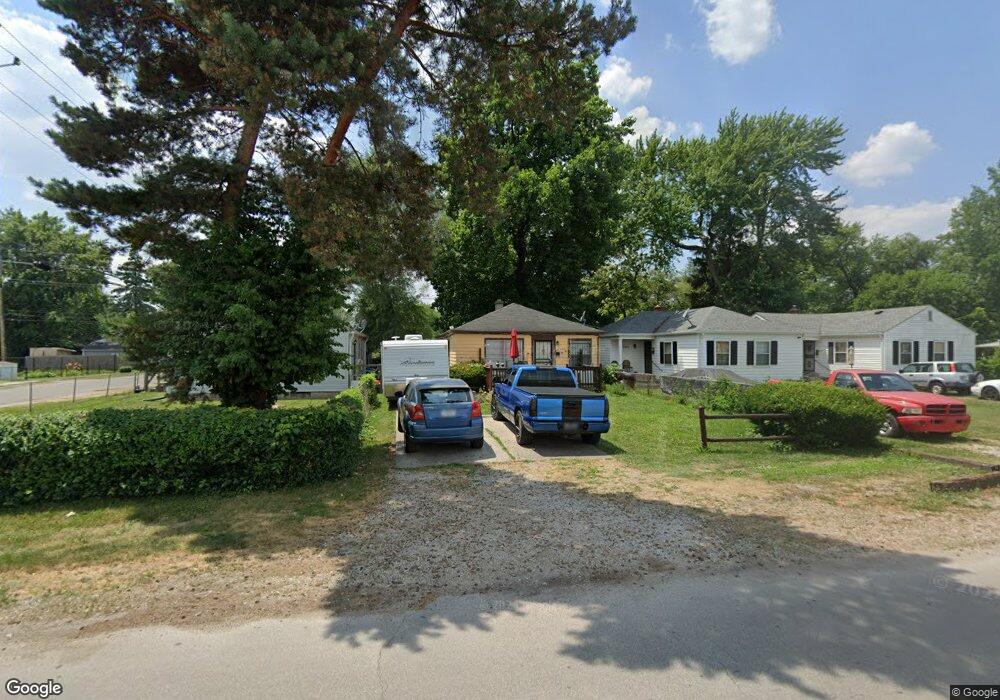
3908 Eastern Ave Indianapolis, IN 46205
Avondale Meadows NeighborhoodEstimated Value: $85,000 - $121,117
2
Beds
--
Bath
816
Sq Ft
$125/Sq Ft
Est. Value
About This Home
This home is located at 3908 Eastern Ave, Indianapolis, IN 46205 and is currently estimated at $101,779, approximately $124 per square foot. 3908 Eastern Ave is a home located in Marion County with nearby schools including James Whitcomb Riley School 43, Robert Lee Frost School 106, and Charles Warren Fairbanks School 105.
Ownership History
Date
Name
Owned For
Owner Type
Purchase Details
Closed on
Sep 27, 2018
Sold by
Dhaliwal Rajbinder S
Bought by
Vapari Residential Llc
Current Estimated Value
Purchase Details
Closed on
Mar 19, 2010
Sold by
Ross Sherri A
Bought by
Dhaliwal Rajbinder S
Purchase Details
Closed on
Mar 18, 2010
Sold by
Hendrickson Terri L
Bought by
Dhaliwal Rajbinder S
Purchase Details
Closed on
May 11, 2007
Sold by
Mckinney Alice B
Bought by
Hendrickson Terri L and Ross Sherri A
Create a Home Valuation Report for This Property
The Home Valuation Report is an in-depth analysis detailing your home's value as well as a comparison with similar homes in the area
Home Values in the Area
Average Home Value in this Area
Purchase History
| Date | Buyer | Sale Price | Title Company |
|---|---|---|---|
| Vapari Residential Llc | -- | None Available | |
| Dhaliwal Rajbinder S | -- | None Available | |
| Dhaliwal Rajbinder S | -- | None Available | |
| Dhaliwal Rajbinder S | -- | None Available | |
| Hendrickson Terri L | -- | None Available |
Source: Public Records
Tax History
| Year | Tax Paid | Tax Assessment Tax Assessment Total Assessment is a certain percentage of the fair market value that is determined by local assessors to be the total taxable value of land and additions on the property. | Land | Improvement |
|---|---|---|---|---|
| 2024 | $1,848 | $73,600 | $14,800 | $58,800 |
| 2023 | $1,848 | $74,200 | $14,800 | $59,400 |
| 2022 | $1,642 | $69,600 | $14,800 | $54,800 |
| 2021 | $1,271 | $51,400 | $5,900 | $45,500 |
| 2020 | $1,081 | $43,100 | $2,300 | $40,800 |
| 2019 | $990 | $65,700 | $2,300 | $63,400 |
| 2018 | $1,456 | $57,800 | $2,300 | $55,500 |
| 2017 | $1,224 | $54,000 | $2,300 | $51,700 |
| 2016 | $1,135 | $51,000 | $2,300 | $48,700 |
| 2014 | $1,097 | $50,700 | $2,300 | $48,400 |
| 2013 | $1,248 | $48,700 | $2,300 | $46,400 |
Source: Public Records
Map
Nearby Homes
- 2525 E 38th St
- 4022 N Tacoma Ave
- 3915 Hillside Ave
- 3640 N Temple Ave
- 3738 Hillside Ave
- 3644 N Parker Ave
- 3706 Hillside Ave
- 2815 E 36th St
- 3758 N Lasalle St
- 3201 E 38th St
- 3551 N Parker Ave
- 3525 N Tacoma Ave
- 4223 Glenwood Dr
- 3640 N Lasalle St
- 3524 Brouse Ave
- 3520 N Keystone Ave
- 3512 N Keystone Ave
- 3748 N Olney St
- 4210 N Lasalle St
- 4233 Evanston Ave
- 3910 Eastern Ave
- 3904 Eastern Ave
- 3914 Eastern Ave
- 2629 E 39th St
- 3920 Eastern Ave
- 3901 N Temple Ave
- 3909 N Temple Ave
- 3913 N Temple Ave
- 3926 Eastern Ave
- 3917 N Temple Ave
- 3845 N Temple Ave
- 3921 N Temple Ave
- 3930 Eastern Ave
- 3929 N Temple Ave
- 3837 N Temple Ave
- 3933 N Temple Ave
- 3833 N Temple Ave
- 3935 N Temple Ave
- 2800 E 39th St
- 3825 N Temple Ave
Your Personal Tour Guide
Ask me questions while you tour the home.