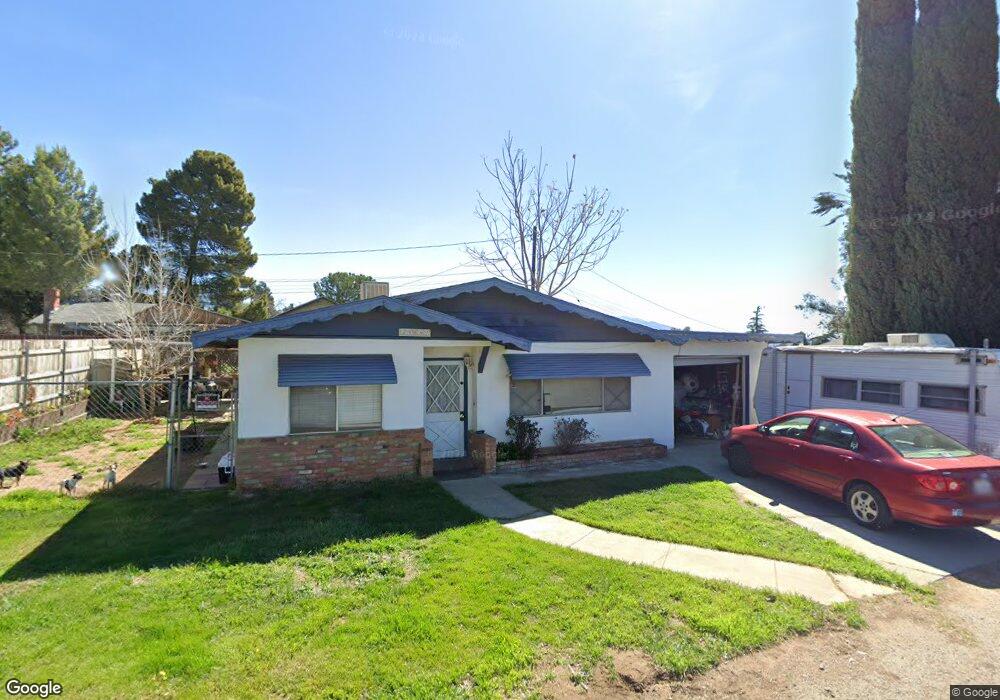
39087 Orchard St Cherry Valley, CA 92223
Estimated Value: $337,125 - $443,000
2
Beds
1
Bath
902
Sq Ft
$430/Sq Ft
Est. Value
About This Home
This home is located at 39087 Orchard St, Cherry Valley, CA 92223 and is currently estimated at $387,781, approximately $429 per square foot. 39087 Orchard St is a home located in Riverside County with nearby schools including Brookside Elementary School, Mountain View Middle School, and Beaumont Senior High School.
Ownership History
Date
Name
Owned For
Owner Type
Purchase Details
Closed on
Sep 6, 2024
Sold by
Andrade Glenda J Tucker and Espinoza Glenda J
Bought by
Espinoza Family Trust and Espinoza
Current Estimated Value
Purchase Details
Closed on
Aug 20, 2013
Sold by
Andrade Glenda J Tucker and Andrade Glenda J
Bought by
Andrade Glenda J Tucker
Home Financials for this Owner
Home Financials are based on the most recent Mortgage that was taken out on this home.
Original Mortgage
$82,000
Interest Rate
4.46%
Mortgage Type
New Conventional
Purchase Details
Closed on
Dec 15, 1998
Sold by
Andrade Glenda J
Bought by
Andrade Glenda J
Home Financials for this Owner
Home Financials are based on the most recent Mortgage that was taken out on this home.
Original Mortgage
$67,500
Interest Rate
6.78%
Purchase Details
Closed on
Mar 16, 1998
Sold by
Andrade Joseph
Bought by
Andrade Glenda J
Create a Home Valuation Report for This Property
The Home Valuation Report is an in-depth analysis detailing your home's value as well as a comparison with similar homes in the area
Home Values in the Area
Average Home Value in this Area
Purchase History
| Date | Buyer | Sale Price | Title Company |
|---|---|---|---|
| Espinoza Family Trust | -- | None Listed On Document | |
| Andrade Glenda J Tucker | -- | First American Title Ins Co | |
| Andrade Glenda J | -- | First American Title Ins Co | |
| Andrade Glenda J | -- | -- |
Source: Public Records
Mortgage History
| Date | Status | Borrower | Loan Amount |
|---|---|---|---|
| Previous Owner | Andrade Glenda J Tucker | $82,000 | |
| Previous Owner | Andrade Glenda J | $67,500 |
Source: Public Records
Tax History
| Year | Tax Paid | Tax Assessment Tax Assessment Total Assessment is a certain percentage of the fair market value that is determined by local assessors to be the total taxable value of land and additions on the property. | Land | Improvement |
|---|---|---|---|---|
| 2025 | $1,264 | $101,499 | $24,342 | $77,157 |
| 2023 | $1,264 | $97,560 | $23,398 | $74,162 |
| 2022 | $1,242 | $95,648 | $22,940 | $72,708 |
| 2021 | $1,217 | $93,774 | $22,491 | $71,283 |
| 2020 | $1,202 | $92,814 | $22,261 | $70,553 |
| 2019 | $1,182 | $90,995 | $21,825 | $69,170 |
| 2018 | $1,174 | $89,212 | $21,398 | $67,814 |
| 2017 | $1,153 | $87,464 | $20,979 | $66,485 |
| 2016 | $1,121 | $85,750 | $20,568 | $65,182 |
| 2015 | $1,101 | $84,463 | $20,260 | $64,203 |
| 2014 | $1,100 | $82,811 | $19,864 | $62,947 |
Source: Public Records
Map
Nearby Homes
- 10007 Beaumont Ave
- 39068 Vineland St
- 9728 Mountain View Ave
- 9710 Mountain View Ave
- 0 Tokay St Unit EV22011453
- 39441 Tokay St
- 10269 Live Oak Ave
- 9575 Oak Glen Rd
- 9902 Avenida Miravilla
- 10410 Live Oak Ave
- 9870 Nancy Ave
- 38535 Vineland St
- 38608 Pass View Dr
- 39657 Baldi Ct
- 38239 Orchard St
- 9110 Oak Creek Rd
- 9187 Bonita Dr
- 9869 Kehl Canyon Rd
- 39380 Oak View Ln
- 39581 Cherry Oak Canyon Rd
- 39091 Orchard St
- 39089 Orchard St
- 39103 Orchard St
- 39093 Orchard St
- 39067 Orchard St
- 39157 Orchard St
- 39145 Orchard St
- 9970 Royal Duke Ct
- 39021 Orchard St
- 39045 Orchard St
- 39167 Orchard St
- 5801 Royale Place
- 10131 Friendship Dr
- 39074 Vineland St
- 9951 Royal Duke Ct
- 10085 Beaumont Ave
- 10043 Beaumont Ave
- 10023 Beaumont Ave
- 10155 Friendship Dr
- 10107 Beaumont Ave
Your Personal Tour Guide
Ask me questions while you tour the home.