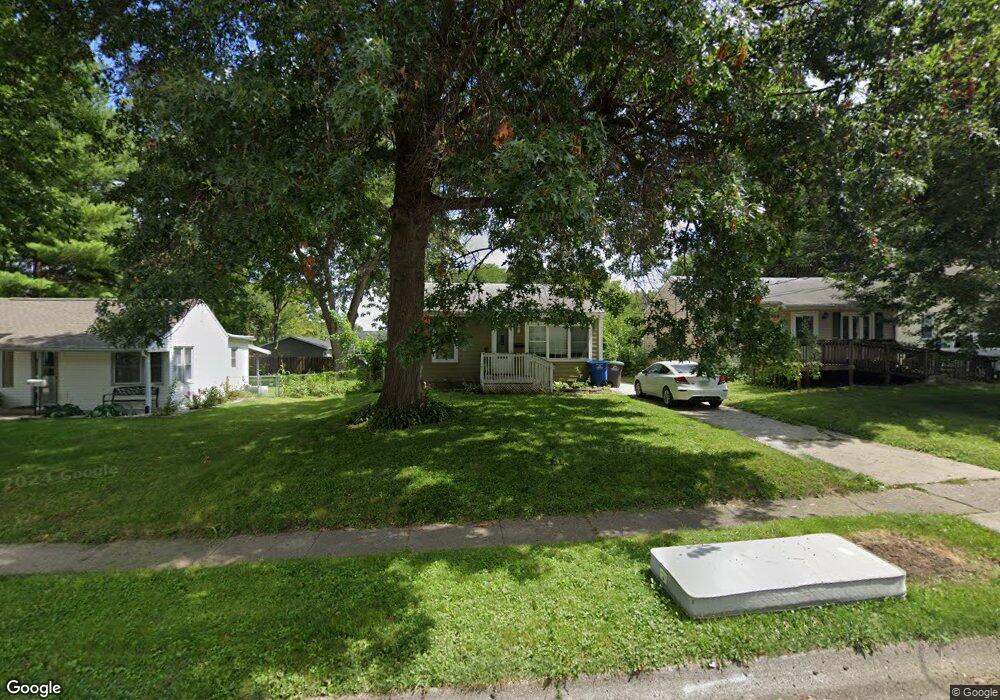
3909 52nd St Des Moines, IA 50310
Merle Hay NeighborhoodEstimated Value: $170,124 - $221,000
3
Beds
1
Bath
1,008
Sq Ft
$193/Sq Ft
Est. Value
About This Home
This home is located at 3909 52nd St, Des Moines, IA 50310 and is currently estimated at $194,281, approximately $192 per square foot. 3909 52nd St is a home located in Polk County with nearby schools including Moore Elementary School, Meredith Middle School, and Hoover High School.
Ownership History
Date
Name
Owned For
Owner Type
Purchase Details
Closed on
Mar 3, 2025
Sold by
Serrano Leticia Reyes
Bought by
Reyes Lucina Gutierrez and Reyes Juan Manuel
Current Estimated Value
Purchase Details
Closed on
Feb 19, 2016
Sold by
Woodlawn Real Estate Llc
Bought by
Serrano Leticia Reyes
Purchase Details
Closed on
May 21, 2003
Sold by
Geisler Paula Marie
Bought by
Ballard Jennifer E
Home Financials for this Owner
Home Financials are based on the most recent Mortgage that was taken out on this home.
Original Mortgage
$86,275
Interest Rate
5.95%
Mortgage Type
FHA
Purchase Details
Closed on
Sep 30, 1998
Sold by
Seward Kathy S and Schlerman Gayle M
Bought by
Geisler Paula Marie
Home Financials for this Owner
Home Financials are based on the most recent Mortgage that was taken out on this home.
Original Mortgage
$70,500
Interest Rate
6.98%
Create a Home Valuation Report for This Property
The Home Valuation Report is an in-depth analysis detailing your home's value as well as a comparison with similar homes in the area
Home Values in the Area
Average Home Value in this Area
Purchase History
| Date | Buyer | Sale Price | Title Company |
|---|---|---|---|
| Reyes Lucina Gutierrez | -- | None Listed On Document | |
| Serrano Leticia Reyes | $98,000 | None Available | |
| Ballard Jennifer E | $94,500 | -- | |
| Geisler Paula Marie | $82,000 | -- |
Source: Public Records
Mortgage History
| Date | Status | Borrower | Loan Amount |
|---|---|---|---|
| Previous Owner | Ballard Jennifer E | $86,275 | |
| Previous Owner | Geisler Paula Marie | $70,500 |
Source: Public Records
Tax History Compared to Growth
Tax History
| Year | Tax Paid | Tax Assessment Tax Assessment Total Assessment is a certain percentage of the fair market value that is determined by local assessors to be the total taxable value of land and additions on the property. | Land | Improvement |
|---|---|---|---|---|
| 2025 | $2,742 | $158,300 | $37,200 | $121,100 |
| 2024 | $2,742 | $139,400 | $32,400 | $107,000 |
| 2023 | $2,852 | $139,400 | $32,400 | $107,000 |
| 2022 | $2,830 | $121,000 | $28,400 | $92,600 |
| 2021 | $2,828 | $121,000 | $28,400 | $92,600 |
| 2020 | $2,938 | $113,300 | $26,500 | $86,800 |
| 2019 | $2,736 | $113,300 | $26,500 | $86,800 |
| 2018 | $2,708 | $101,800 | $23,200 | $78,600 |
| 2017 | $2,500 | $101,800 | $23,200 | $78,600 |
| 2016 | $2,434 | $92,400 | $20,800 | $71,600 |
| 2015 | $2,434 | $92,400 | $20,800 | $71,600 |
| 2014 | $2,106 | $84,400 | $18,600 | $65,800 |
Source: Public Records
Map
Nearby Homes