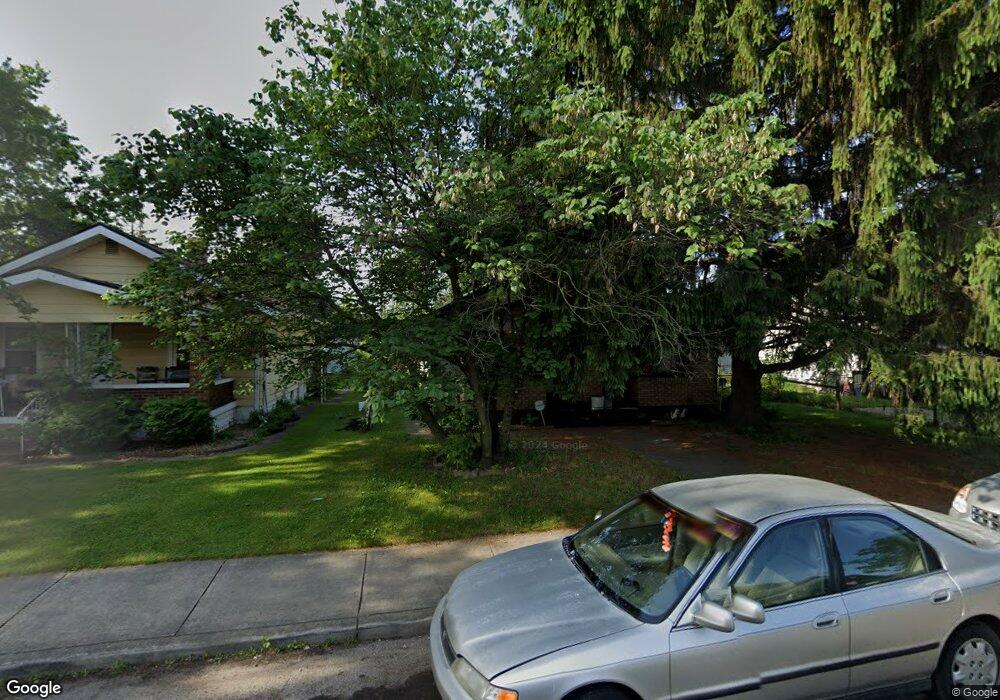
3909 E 11th St Indianapolis, IN 46201
Near Eastside NeighborhoodEstimated Value: $142,000 - $167,000
2
Beds
--
Bath
560
Sq Ft
$276/Sq Ft
Est. Value
About This Home
This home is located at 3909 E 11th St, Indianapolis, IN 46201 and is currently estimated at $154,500, approximately $275 per square foot. 3909 E 11th St is a home located in Marion County with nearby schools including Thomas D. Gregg School No. 15, Washington Irving School 14, and Brookside School 54.
Ownership History
Date
Name
Owned For
Owner Type
Purchase Details
Closed on
Mar 7, 2025
Sold by
Michael Drew Ira and Equity Trust Company
Bought by
Smith Joshua
Current Estimated Value
Home Financials for this Owner
Home Financials are based on the most recent Mortgage that was taken out on this home.
Original Mortgage
$134,250
Outstanding Balance
$133,109
Interest Rate
6.95%
Mortgage Type
New Conventional
Estimated Equity
$21,391
Purchase Details
Closed on
Dec 27, 2024
Sold by
Artis And Pace Investments
Bought by
Equity Trust and Michael Drew Ira
Purchase Details
Closed on
Nov 18, 2024
Sold by
Sheriff Of Marion County State Of Indian
Bought by
Artis And Pace Investments
Purchase Details
Closed on
Jun 18, 2013
Sold by
Curtis Christina N and Curtis Christina N
Bought by
Allyson Enterprises Llc
Create a Home Valuation Report for This Property
The Home Valuation Report is an in-depth analysis detailing your home's value as well as a comparison with similar homes in the area
Home Values in the Area
Average Home Value in this Area
Purchase History
| Date | Buyer | Sale Price | Title Company |
|---|---|---|---|
| Smith Joshua | -- | Eagle Land Title | |
| Equity Trust | -- | None Listed On Document | |
| Equity Trust | -- | None Listed On Document | |
| Artis And Pace Investments | $65,654 | None Listed On Document | |
| Artis And Pace Investments | $65,554 | None Listed On Document | |
| Allyson Enterprises Llc | -- | -- |
Source: Public Records
Mortgage History
| Date | Status | Borrower | Loan Amount |
|---|---|---|---|
| Open | Smith Joshua | $134,250 |
Source: Public Records
Tax History
| Year | Tax Paid | Tax Assessment Tax Assessment Total Assessment is a certain percentage of the fair market value that is determined by local assessors to be the total taxable value of land and additions on the property. | Land | Improvement |
|---|---|---|---|---|
| 2024 | $1,985 | $89,800 | $12,200 | $77,600 |
| 2023 | $1,985 | $79,400 | $12,200 | $67,200 |
| 2022 | $1,902 | $76,800 | $12,200 | $64,600 |
| 2021 | $1,838 | $75,800 | $12,200 | $63,600 |
| 2020 | $1,642 | $67,100 | $4,900 | $62,200 |
| 2019 | $1,523 | $60,900 | $4,900 | $56,000 |
| 2018 | $1,325 | $52,100 | $4,900 | $47,200 |
| 2017 | $1,069 | $46,100 | $4,900 | $41,200 |
| 2016 | $1,007 | $44,100 | $4,900 | $39,200 |
| 2014 | $962 | $44,700 | $4,900 | $39,800 |
| 2013 | $954 | $46,000 | $4,900 | $41,100 |
Source: Public Records
Map
Nearby Homes
- 3915 E 11th St
- 958 N Denny St
- 3832 E 10th St
- 4012 E 11th St
- 925 N Chester Ave
- 1213 N Denny St
- 1114 N Gladstone Ave
- 1168 N Gladstone Ave
- 1219 N Grant Ave
- 3810 E 9th St
- 1023 N Kealing Ave
- 1214 N Gladstone Ave
- 3834 E 13th St
- 1318 N Grant Ave
- 1106 N Kealing Ave
- 813 N Denny St
- 1328 N Chester Ave
- 1324 N Gladstone Ave
- 930 N Kealing Ave
- 833 N Gladstone Ave
- 1029 N Denny St
- 1025 N Denny St
- 1017 N Denny St
- 3919 E 11th St
- 3921 E 11th St
- 3925 E 11th St
- 4017 E 11th St
- 3910 E 11th St
- 3908 E 11th St
- 1028 N Denny St
- 3914 E 11th St
- 3912 E 10th St
- 1020 N Denny St
- 3902 E 11th St
- 3920 E 11th St
- 3920 E 10th St
- 3933 E 11th St
- 3928 E 11th St
- 3922 E 10th St
- 3843 E 11th St
Your Personal Tour Guide
Ask me questions while you tour the home.