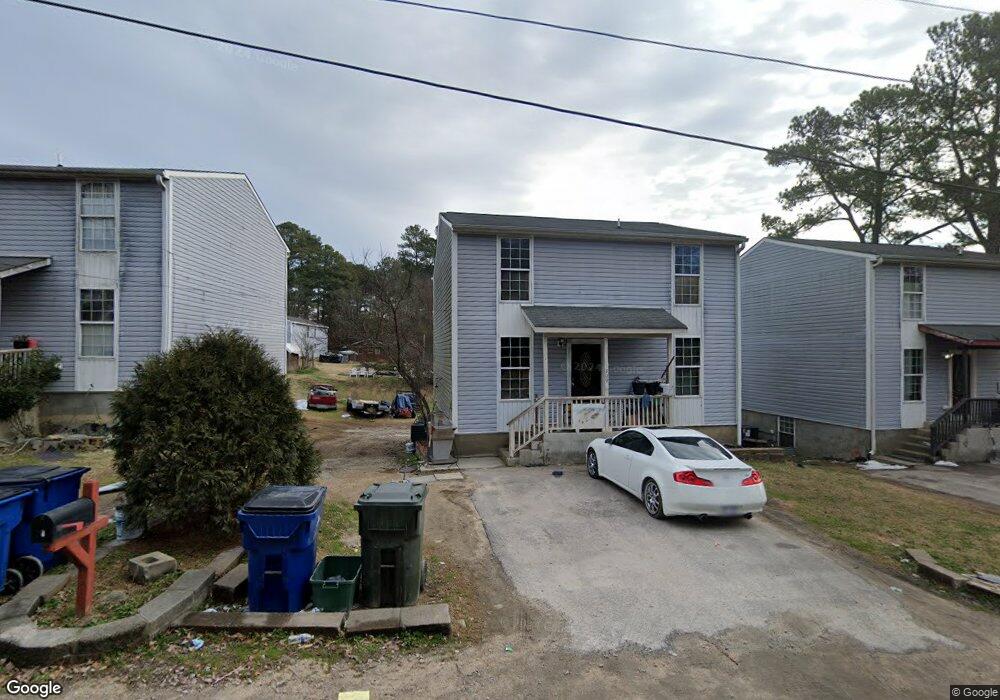
3909 Virginia St Raleigh, NC 27610
Southeast Raleigh NeighborhoodEstimated Value: $283,000 - $412,000
3
Beds
2
Baths
1,266
Sq Ft
$263/Sq Ft
Est. Value
About This Home
This home is located at 3909 Virginia St, Raleigh, NC 27610 and is currently estimated at $333,333, approximately $263 per square foot. 3909 Virginia St is a home located in Wake County with nearby schools including Partnership Elementary School, Moore Square Museum Magnet Middle School, and Southeast Raleigh Magnet High School.
Ownership History
Date
Name
Owned For
Owner Type
Purchase Details
Closed on
Oct 18, 2011
Sold by
Walter Mortgage Company Llc
Bought by
Camp Larry R
Current Estimated Value
Home Financials for this Owner
Home Financials are based on the most recent Mortgage that was taken out on this home.
Original Mortgage
$46,875
Outstanding Balance
$31,955
Interest Rate
4.09%
Mortgage Type
Purchase Money Mortgage
Estimated Equity
$301,378
Purchase Details
Closed on
May 31, 2011
Sold by
Vernon Vernon Jay and Vernon Terri L
Bought by
Walter Mortgage Company Llc
Purchase Details
Closed on
Feb 2, 2009
Sold by
Vernon Terri L
Bought by
Vernon Vernon J
Home Financials for this Owner
Home Financials are based on the most recent Mortgage that was taken out on this home.
Original Mortgage
$75,000
Interest Rate
5.15%
Mortgage Type
Seller Take Back
Create a Home Valuation Report for This Property
The Home Valuation Report is an in-depth analysis detailing your home's value as well as a comparison with similar homes in the area
Home Values in the Area
Average Home Value in this Area
Purchase History
| Date | Buyer | Sale Price | Title Company |
|---|---|---|---|
| Camp Larry R | $125,000 | None Available | |
| Walter Mortgage Company Llc | $270,654 | None Available | |
| Vernon Vernon J | -- | None Available |
Source: Public Records
Mortgage History
| Date | Status | Borrower | Loan Amount |
|---|---|---|---|
| Open | Camp Larry R | $46,875 | |
| Previous Owner | Vernon Vernon J | $75,000 |
Source: Public Records
Tax History Compared to Growth
Tax History
| Year | Tax Paid | Tax Assessment Tax Assessment Total Assessment is a certain percentage of the fair market value that is determined by local assessors to be the total taxable value of land and additions on the property. | Land | Improvement |
|---|---|---|---|---|
| 2025 | $3,354 | $375,453 | $56,000 | $319,453 |
| 2024 | $3,341 | $375,453 | $56,000 | $319,453 |
| 2023 | $2,511 | $223,021 | $52,500 | $170,521 |
| 2022 | $2,338 | $223,021 | $52,500 | $170,521 |
| 2021 | $2,250 | $223,021 | $52,500 | $170,521 |
| 2020 | $2,210 | $223,021 | $52,500 | $170,521 |
| 2019 | $1,967 | $162,789 | $16,000 | $146,789 |
| 2018 | $1,859 | $162,789 | $16,000 | $146,789 |
| 2017 | $1,773 | $162,789 | $16,000 | $146,789 |
| 2016 | $1,739 | $162,789 | $16,000 | $146,789 |
| 2015 | $2,069 | $192,045 | $21,000 | $171,045 |
| 2014 | $1,966 | $192,045 | $21,000 | $171,045 |
Source: Public Records
Map
Nearby Homes
- 1340 Beacon Village Dr
- 1431 Beacon Village Dr
- 4225 Lake Woodard Dr
- 4255 Lake Woodard Dr
- 4212 Beacon Crest Way
- 1809 Billingham Ct
- 3151 New Bern Ave
- 3500 Mount Ct
- 2023 Seneca Dr
- 3521 Piedmont Dr
- 2316 Carthage Cir
- 3607 Elm Grove Ln
- 3601 Elm Grove Ln
- 3213 Marie Dr
- 2103 Kilburn Rd
- 2108 Carthage Cir
- 3455 Piedmont Dr
- Ellerbe Plan at Piedmont Point
- 3225 Marie Dr
- 2209 Dobbin Place
- 3913 Virginia St
- 3905 Virginia St
- 3806 Thelma St
- 3810 Thelma St
- 3815 Virginia St
- 3917 Virginia St
- 3910 Virginia St
- 3915 Virginia St
- 3915 Virginia St Unit 5 units
- 3816 Thelma St
- 3816 Thelma St E
- 3809 Virginia St
- 3807 Thelma St
- 4001 Virginia St
- 3900 Thelma St
- 3815 Thelma St
- 3715 Polly St
- 3904 Thelma St
- 3901 - 390 Thelma St
- 3910 Thelma St