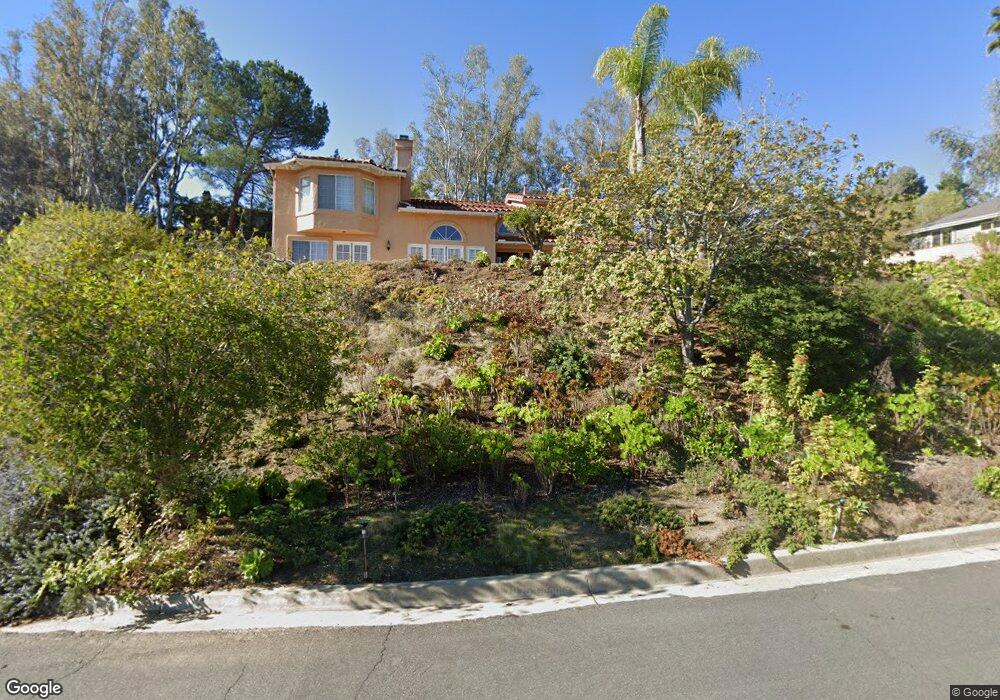
391 Dos Cabazos Escondido, CA 92029
Lake Hodges NeighborhoodEstimated Value: $1,372,000 - $1,600,000
4
Beds
3
Baths
2,998
Sq Ft
$490/Sq Ft
Est. Value
About This Home
This home is located at 391 Dos Cabazos, Escondido, CA 92029 and is currently estimated at $1,470,448, approximately $490 per square foot. 391 Dos Cabazos is a home located in San Diego County with nearby schools including Bernardo Elementary School, Bear Valley Middle School, and San Pasqual High School.
Ownership History
Date
Name
Owned For
Owner Type
Purchase Details
Closed on
Nov 24, 2003
Sold by
Vannguyen Trong and Hoang Thu Thi
Bought by
Vannguyen Trong and Hoang Thu Thi
Current Estimated Value
Purchase Details
Closed on
Nov 20, 1996
Sold by
Mark Wankier and Linda Wankier
Bought by
Vannguyen Trong and Hoang Thu Thi
Home Financials for this Owner
Home Financials are based on the most recent Mortgage that was taken out on this home.
Original Mortgage
$147,000
Outstanding Balance
$11,732
Interest Rate
5.87%
Estimated Equity
$1,458,716
Purchase Details
Closed on
Oct 28, 1996
Sold by
Wankier Deborah Ann
Bought by
Wankier Mark Douglas
Home Financials for this Owner
Home Financials are based on the most recent Mortgage that was taken out on this home.
Original Mortgage
$147,000
Outstanding Balance
$11,732
Interest Rate
5.87%
Estimated Equity
$1,458,716
Purchase Details
Closed on
Dec 22, 1993
Sold by
Wankier Mark and Wankier Linda
Bought by
Wankier Mark and Wankier Linda
Purchase Details
Closed on
Aug 24, 1990
Create a Home Valuation Report for This Property
The Home Valuation Report is an in-depth analysis detailing your home's value as well as a comparison with similar homes in the area
Home Values in the Area
Average Home Value in this Area
Purchase History
| Date | Buyer | Sale Price | Title Company |
|---|---|---|---|
| Vannguyen Trong | -- | -- | |
| Vannguyen Trong | $267,000 | Fidelity National Title | |
| Wankier Mark Douglas | -- | Fidelity National Title | |
| Wankier Mark | -- | -- | |
| -- | $370,000 | -- |
Source: Public Records
Mortgage History
| Date | Status | Borrower | Loan Amount |
|---|---|---|---|
| Open | Vannguyen Trong | $147,000 |
Source: Public Records
Tax History
| Year | Tax Paid | Tax Assessment Tax Assessment Total Assessment is a certain percentage of the fair market value that is determined by local assessors to be the total taxable value of land and additions on the property. | Land | Improvement |
|---|---|---|---|---|
| 2025 | $4,892 | $434,837 | $162,856 | $271,981 |
| 2024 | $4,892 | $426,312 | $159,663 | $266,649 |
| 2023 | $4,781 | $417,954 | $156,533 | $261,421 |
| 2022 | $4,730 | $409,760 | $153,464 | $256,296 |
| 2021 | $4,654 | $401,726 | $150,455 | $251,271 |
| 2020 | $4,627 | $397,608 | $148,913 | $248,695 |
| 2019 | $4,515 | $389,813 | $145,994 | $243,819 |
| 2018 | $4,391 | $382,171 | $143,132 | $239,039 |
| 2017 | $4,320 | $374,678 | $140,326 | $234,352 |
| 2016 | $4,237 | $367,332 | $137,575 | $229,757 |
| 2015 | $4,202 | $361,815 | $135,509 | $226,306 |
| 2014 | $4,028 | $354,728 | $132,855 | $221,873 |
Source: Public Records
Map
Nearby Homes
- 0 Quiet Hills Farm Rd Unit NDP2503930
- 1051 W Via Rancho Pkwy
- 2927 Circle Dr
- 3439 Via Loma Vista
- 3565 Via Loma Vista
- 606 Gardenia Glen
- 18910 Caminito Cantilena Unit 10
- 2632 Buckwheat Glen
- 2627 Buckwheat Glen
- 308 Cueva Glen
- 2345 Miller Ave
- 2618 Buckwheat Glen
- 2601 Cranston Dr Unit 706
- 2532 S Escondido Blvd Unit 204
- 18826 Caminito Cantilena Unit 111
- 18812 Caminito Cantilena Unit 124
- 728 Inspiration Ln
- 18752 Caminito Cantilena Unit 166
- 18752 Caminito Cantilena Unit 176
- 18754 Caminito Pasadero
- 411 Dos Cabazos
- 434 Avenida Adobe
- 355 W Via Rancho Pkwy
- 361 W Via Rancho Pkwy
- 431 Dos Cabazos
- 371 Dos Cabazos
- 440 Avenida Adobe
- 437 Old Via Rancho Dr
- 428 Avenida Adobe
- 347 W Via Rancho Pkwy
- 458 Avenida Adobe
- 443 Old Via Rancho Dr
- 3313 Avenida Sierra
- 3198 Avenida Hacienda
- 3194 Avenida Hacienda
- 3190 Avenida Hacienda
- 3202 Avenida Hacienda
- 3317 Avenida Sierra
- 3265 Avenida Magoria
- 3243 Avenida Magoria