Estimated Value: $476,008 - $670,000
3
Beds
2
Baths
2,016
Sq Ft
$274/Sq Ft
Est. Value
About This Home
This home is located at 391 E Sullivan St, Allyn, WA 98524 and is currently estimated at $551,502, approximately $273 per square foot. 391 E Sullivan St is a home located in Mason County with nearby schools including North Mason Senior High School.
Ownership History
Date
Name
Owned For
Owner Type
Purchase Details
Closed on
Mar 9, 2006
Sold by
Short Erin L
Bought by
Esler Tina M
Current Estimated Value
Home Financials for this Owner
Home Financials are based on the most recent Mortgage that was taken out on this home.
Original Mortgage
$120,000
Outstanding Balance
$69,134
Interest Rate
6.5%
Mortgage Type
Adjustable Rate Mortgage/ARM
Estimated Equity
$482,368
Purchase Details
Closed on
Aug 10, 2005
Sold by
Short Thomas R
Bought by
Short Erin L
Create a Home Valuation Report for This Property
The Home Valuation Report is an in-depth analysis detailing your home's value as well as a comparison with similar homes in the area
Home Values in the Area
Average Home Value in this Area
Purchase History
| Date | Buyer | Sale Price | Title Company |
|---|---|---|---|
| Esler Tina M | $102,000 | Land Title Co | |
| Short Erin L | -- | None Available |
Source: Public Records
Mortgage History
| Date | Status | Borrower | Loan Amount |
|---|---|---|---|
| Open | Esler Tina M | $120,000 |
Source: Public Records
Tax History Compared to Growth
Tax History
| Year | Tax Paid | Tax Assessment Tax Assessment Total Assessment is a certain percentage of the fair market value that is determined by local assessors to be the total taxable value of land and additions on the property. | Land | Improvement |
|---|---|---|---|---|
| 2025 | $3,335 | $392,055 | $31,630 | $360,425 |
| 2023 | $3,335 | $371,530 | $26,425 | $345,105 |
| 2022 | $3,663 | $407,160 | $21,775 | $385,385 |
| 2021 | $2,401 | $407,160 | $21,775 | $385,385 |
| 2020 | $2,511 | $276,800 | $19,795 | $257,005 |
| 2018 | $2,375 | $201,390 | $18,850 | $182,540 |
| 2017 | $2,111 | $201,305 | $18,765 | $182,540 |
| 2016 | $1,868 | $184,710 | $18,765 | $165,945 |
| 2015 | $1,944 | $164,010 | $14,100 | $149,910 |
| 2014 | -- | $172,875 | $14,250 | $158,625 |
| 2013 | -- | $160,170 | $12,000 | $148,170 |
Source: Public Records
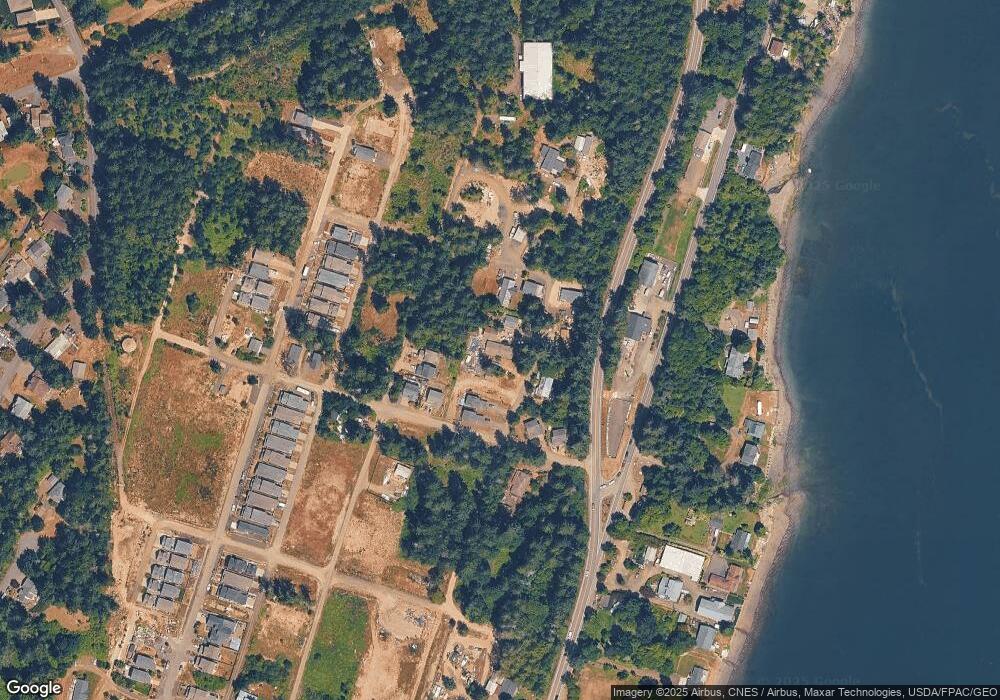
Map
Nearby Homes
- 381 E Sullivan St
- 371 E Sullivan St
- 0 xxxx E Sullivan St
- 140 E Sullivan St
- 62 E North Bay Rd
- 0 xxx Wheelwright St N
- 10 E Compass Ln
- 61 E Brady Loop
- 60 Compass Ln E Unit A98524
- 0 Sullivan Rd
- 391 E Rainier Dr
- 19011 Washington 3 Unit A
- 181 E Rainier Ct
- 19013 Washington 3 Unit A-B
- 19013 Washington 3 Unit B
- 19013 Washington 3 Unit A
- 130 E Olympic Ct
- 19015 E State Route 3 Unit B
- 19015 E State Route 3 Unit A-B
- 19015 E State Route 3 Unit A
- 411 E Sullivan St
- 520 E Wheelright St
- 361 E Sullivan St
- 520 E Wheelwright St N
- 412 E Sullivan St Unit A
- 412 E Sullivan St Unit A & B
- 500 E Wheelwright St N
- 70 E Wade St
- 351 E Sullivan St
- 430 E Sullivan St
- 90 E Wade St
- 40 E Wade St
- 30 E Wade St
- 31 E Wade St
- 161 Wade St
- 220 E Blackwell St
- 240 E Blackwell St
- 470 E Wheelright St N
- 210 E Blackwell St
- 250 E Blackwell St