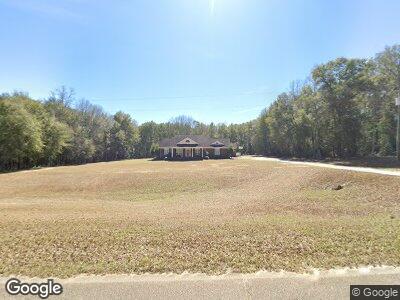
391 Rogers Rd Preston, GA 31824
Estimated Value: $170,000 - $546,000
3
Beds
3
Baths
2,589
Sq Ft
$134/Sq Ft
Est. Value
About This Home
This home is located at 391 Rogers Rd, Preston, GA 31824 and is currently estimated at $347,313, approximately $134 per square foot. 391 Rogers Rd is a home located in Webster County with nearby schools including Webster County Elementary/Middle School and Webster County High School.
Ownership History
Date
Name
Owned For
Owner Type
Purchase Details
Closed on
Mar 27, 2003
Sold by
Bank Of Terrell
Bought by
Hart Jay D
Current Estimated Value
Purchase Details
Closed on
Feb 3, 2003
Sold by
Hart Jay D
Bought by
Rodgers
Purchase Details
Closed on
Jan 28, 2003
Sold by
Hart Jay D
Bought by
Rodgers Mark and Rodgers Becky
Purchase Details
Closed on
Aug 13, 1999
Sold by
Walker Steve
Bought by
Hart Jay D
Create a Home Valuation Report for This Property
The Home Valuation Report is an in-depth analysis detailing your home's value as well as a comparison with similar homes in the area
Home Values in the Area
Average Home Value in this Area
Purchase History
| Date | Buyer | Sale Price | Title Company |
|---|---|---|---|
| Hart Jay D | -- | -- | |
| Rodgers | $12,500 | -- | |
| Rodgers Mark | -- | -- | |
| Hart Jay D | $7,500 | -- |
Source: Public Records
Mortgage History
| Date | Status | Borrower | Loan Amount |
|---|---|---|---|
| Open | Rodgers Mark | $223,900 | |
| Closed | Rodgers Mark | $241,900 | |
| Closed | Rodgers Mark | $252,000 | |
| Closed | Rodgers Mark | $20,000 | |
| Closed | Rodgers Mark E | $256,500 | |
| Closed | Rodgers Mark | $13,500 |
Source: Public Records
Tax History Compared to Growth
Tax History
| Year | Tax Paid | Tax Assessment Tax Assessment Total Assessment is a certain percentage of the fair market value that is determined by local assessors to be the total taxable value of land and additions on the property. | Land | Improvement |
|---|---|---|---|---|
| 2024 | $2,927 | $84,720 | $6,440 | $78,280 |
| 2023 | $2,187 | $84,720 | $6,440 | $78,280 |
| 2022 | $2,204 | $84,560 | $6,440 | $78,120 |
| 2021 | $2,186 | $84,560 | $6,440 | $78,120 |
| 2020 | $2,186 | $84,560 | $6,440 | $78,120 |
| 2019 | $2,186 | $84,560 | $6,440 | $78,120 |
| 2018 | $2,186 | $84,560 | $6,440 | $78,120 |
| 2017 | $2,186 | $84,560 | $6,440 | $78,120 |
| 2016 | $2,186 | $84,560 | $6,440 | $78,120 |
| 2015 | -- | $84,560 | $6,440 | $78,120 |
| 2014 | -- | $84,560 | $6,440 | $78,120 |
| 2013 | -- | $85,240 | $4,720 | $80,520 |
Source: Public Records
Map
Nearby Homes
- 6414 Hamilton St
- 133 Winter Dr
- 115 Deer Camp Rd
- 4283 W Centerpoint Rd
- 2548 Churchill Rd
- 0 Rd Unit 11290139
- 621 Alston St
- 000 Broad St
- 1359 Wall St
- 0 Broad St
- 444 Sarah Dew Rd
- 2508 Red Hill Rd
- 2055 Payne Pond Rd
- 0 Carter Fishpond Rd
- 0 Peach Orchard Rd
- 1292 Cool Springs Rd
- 1504 U S Highway 280
- 0 Harry Priddy Rd
- 136 Loop Rd
- 0 Welch Rd Unit 10319130