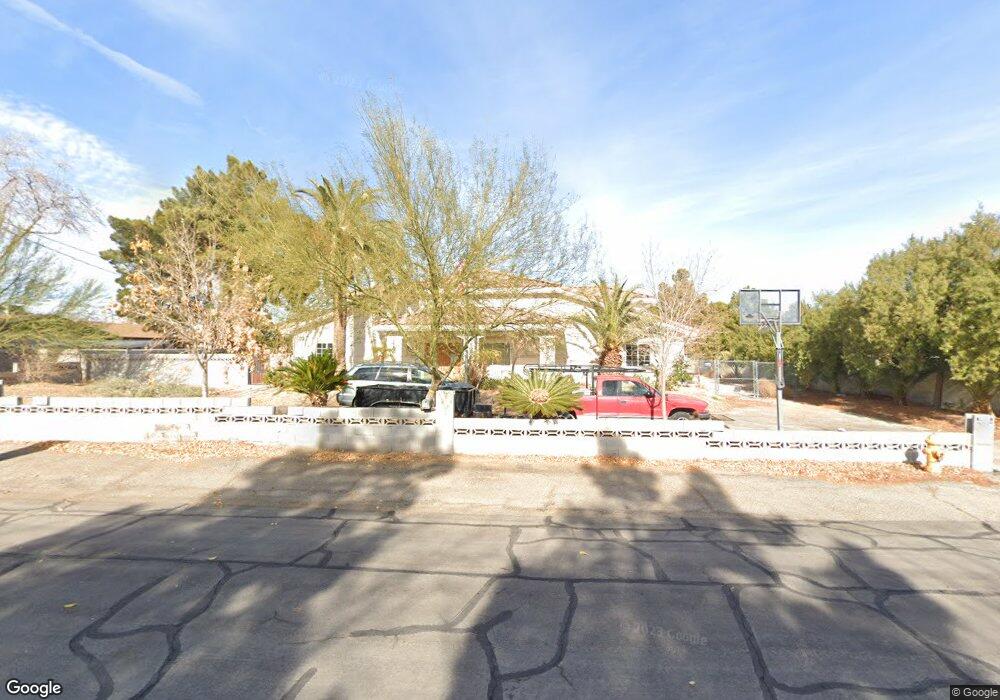
3910 Mountain View Blvd Las Vegas, NV 89102
Buffalo NeighborhoodEstimated Value: $706,447 - $832,000
4
Beds
3
Baths
2,249
Sq Ft
$342/Sq Ft
Est. Value
About This Home
This home is located at 3910 Mountain View Blvd, Las Vegas, NV 89102 and is currently estimated at $768,362, approximately $341 per square foot. 3910 Mountain View Blvd is a home located in Clark County with nearby schools including Vegas Verdes Elementary School, Hyde Park Middle School, and Ed W Clark High School.
Ownership History
Date
Name
Owned For
Owner Type
Purchase Details
Closed on
Jun 5, 2008
Sold by
Bryant Douglas M and Bryant Ann J
Bought by
Marhenke Steven K and Marhenke Jindaporn
Current Estimated Value
Home Financials for this Owner
Home Financials are based on the most recent Mortgage that was taken out on this home.
Original Mortgage
$355,250
Outstanding Balance
$227,379
Interest Rate
6%
Mortgage Type
FHA
Estimated Equity
$540,983
Create a Home Valuation Report for This Property
The Home Valuation Report is an in-depth analysis detailing your home's value as well as a comparison with similar homes in the area
Home Values in the Area
Average Home Value in this Area
Purchase History
| Date | Buyer | Sale Price | Title Company |
|---|---|---|---|
| Marhenke Steven K | $365,000 | First American Title Howard |
Source: Public Records
Mortgage History
| Date | Status | Borrower | Loan Amount |
|---|---|---|---|
| Open | Marhenke Steven K | $355,250 |
Source: Public Records
Tax History Compared to Growth
Tax History
| Year | Tax Paid | Tax Assessment Tax Assessment Total Assessment is a certain percentage of the fair market value that is determined by local assessors to be the total taxable value of land and additions on the property. | Land | Improvement |
|---|---|---|---|---|
| 2025 | $2,762 | $146,170 | $74,690 | $71,480 |
| 2024 | $2,682 | $146,170 | $74,690 | $71,480 |
| 2023 | $2,682 | $134,939 | $70,455 | $64,484 |
| 2022 | $1,194 | $115,978 | $57,750 | $58,228 |
| 2021 | $2,528 | $98,222 | $43,890 | $54,332 |
| 2020 | $2,452 | $96,636 | $43,505 | $53,131 |
| 2019 | $2,380 | $92,923 | $41,580 | $51,343 |
| 2018 | $2,311 | $85,185 | $34,650 | $50,535 |
| 2017 | $2,728 | $83,216 | $30,415 | $52,801 |
| 2016 | $1,194 | $36,294 | $13,475 | $22,819 |
| 2015 | $1,190 | $35,234 | $12,320 | $22,914 |
| 2014 | $1,151 | $35,902 | $12,320 | $23,582 |
Source: Public Records
Map
Nearby Homes
- 4030 Del Monte Ave
- 3909 W Oakey Blvd
- 1336 Darmak Dr
- 1127 Melville Dr
- 4300 Del Monte Ave
- 3506 Westleigh Ave
- 4210 Bossart Ct
- 1115 Douglas Dr
- 1905 Plaza Del Padre
- 2013 Las Verdes St
- 4504 Exposition Ave
- 4308 El Cederal Ave
- 2013 El Greco St
- 2100 Plaza Del Padre
- 2105 El Greco St
- 1505 Flag Cir
- 2205 Las Verdes St
- 4600 Exposition Ave
- 1600 Eaton Dr
- 4413 Buckeye Ave
- 4000 Mountain View Blvd
- 3911 Mountain View Blvd
- 4011 Mountain View Blvd
- 4020 Mountain View Blvd
- 4021 Mountain View Blvd
- 4008 Del Monte Ave
- 4012 Del Monte Ave
- 4028 Mountain View Blvd
- 1400 S Valley View Blvd
- 1400 Hinson St
- 4024 Del Monte Ave
- 4029 Mountain View Blvd
- 4009 Del Monte Ave
- 4021 Del Monte Ave
- 4037 Mountain View Blvd
- 1414 Hinson St
- 1418 Hinson St
- 1610 Hinson St
- 4040 Mountain View Blvd
- 4208 Mountain View Blvd